BTC/USD
+0.68%
Add to/Remove from Watchlist
Add to Watchlist
Add Position
Position added successfully to:
Please name your holdings portfolio
Type:
BUY
SELL
Date:
Amount:
Price
Point Value:
Leverage:
1:1
1:10
1:25
1:50
1:100
1:200
1:400
1:500
1:1000
Commission:
Create New Watchlist
Create
Create a new holdings portfolio
Add
Create
+ Add another position
Close
ETH/USD
+2.31%
Add to/Remove from Watchlist
Add to Watchlist
Add Position
Position added successfully to:
Please name your holdings portfolio
Type:
BUY
SELL
Date:
Amount:
Price
Point Value:
Leverage:
1:1
1:10
1:25
1:50
1:100
1:200
1:400
1:500
1:1000
Commission:
Create New Watchlist
Create
Create a new holdings portfolio
Add
Create
+ Add another position
Close
Last week, Bitcoin held onto support at $26,500
Meanwhile, Ethereum broke its downtrend, surging above $1,900
Both cryptos recently bounced off the support area, now eyeing critical resistance levels
In May, Bitcoin lost over 10% of its value before stabilizing a little. During this time, trading volumes remained low as sellers’ strength started to weaken.
The sideways movement was largely a result of the uncertainty in global markets. However, as market sentiment improved and the U.S. debt ceiling crisis risks abated, Bitcoin rallied.
The perceived decrease in the risk of a U.S. default led to a 5% move as the crypto moved toward an important resistance level.
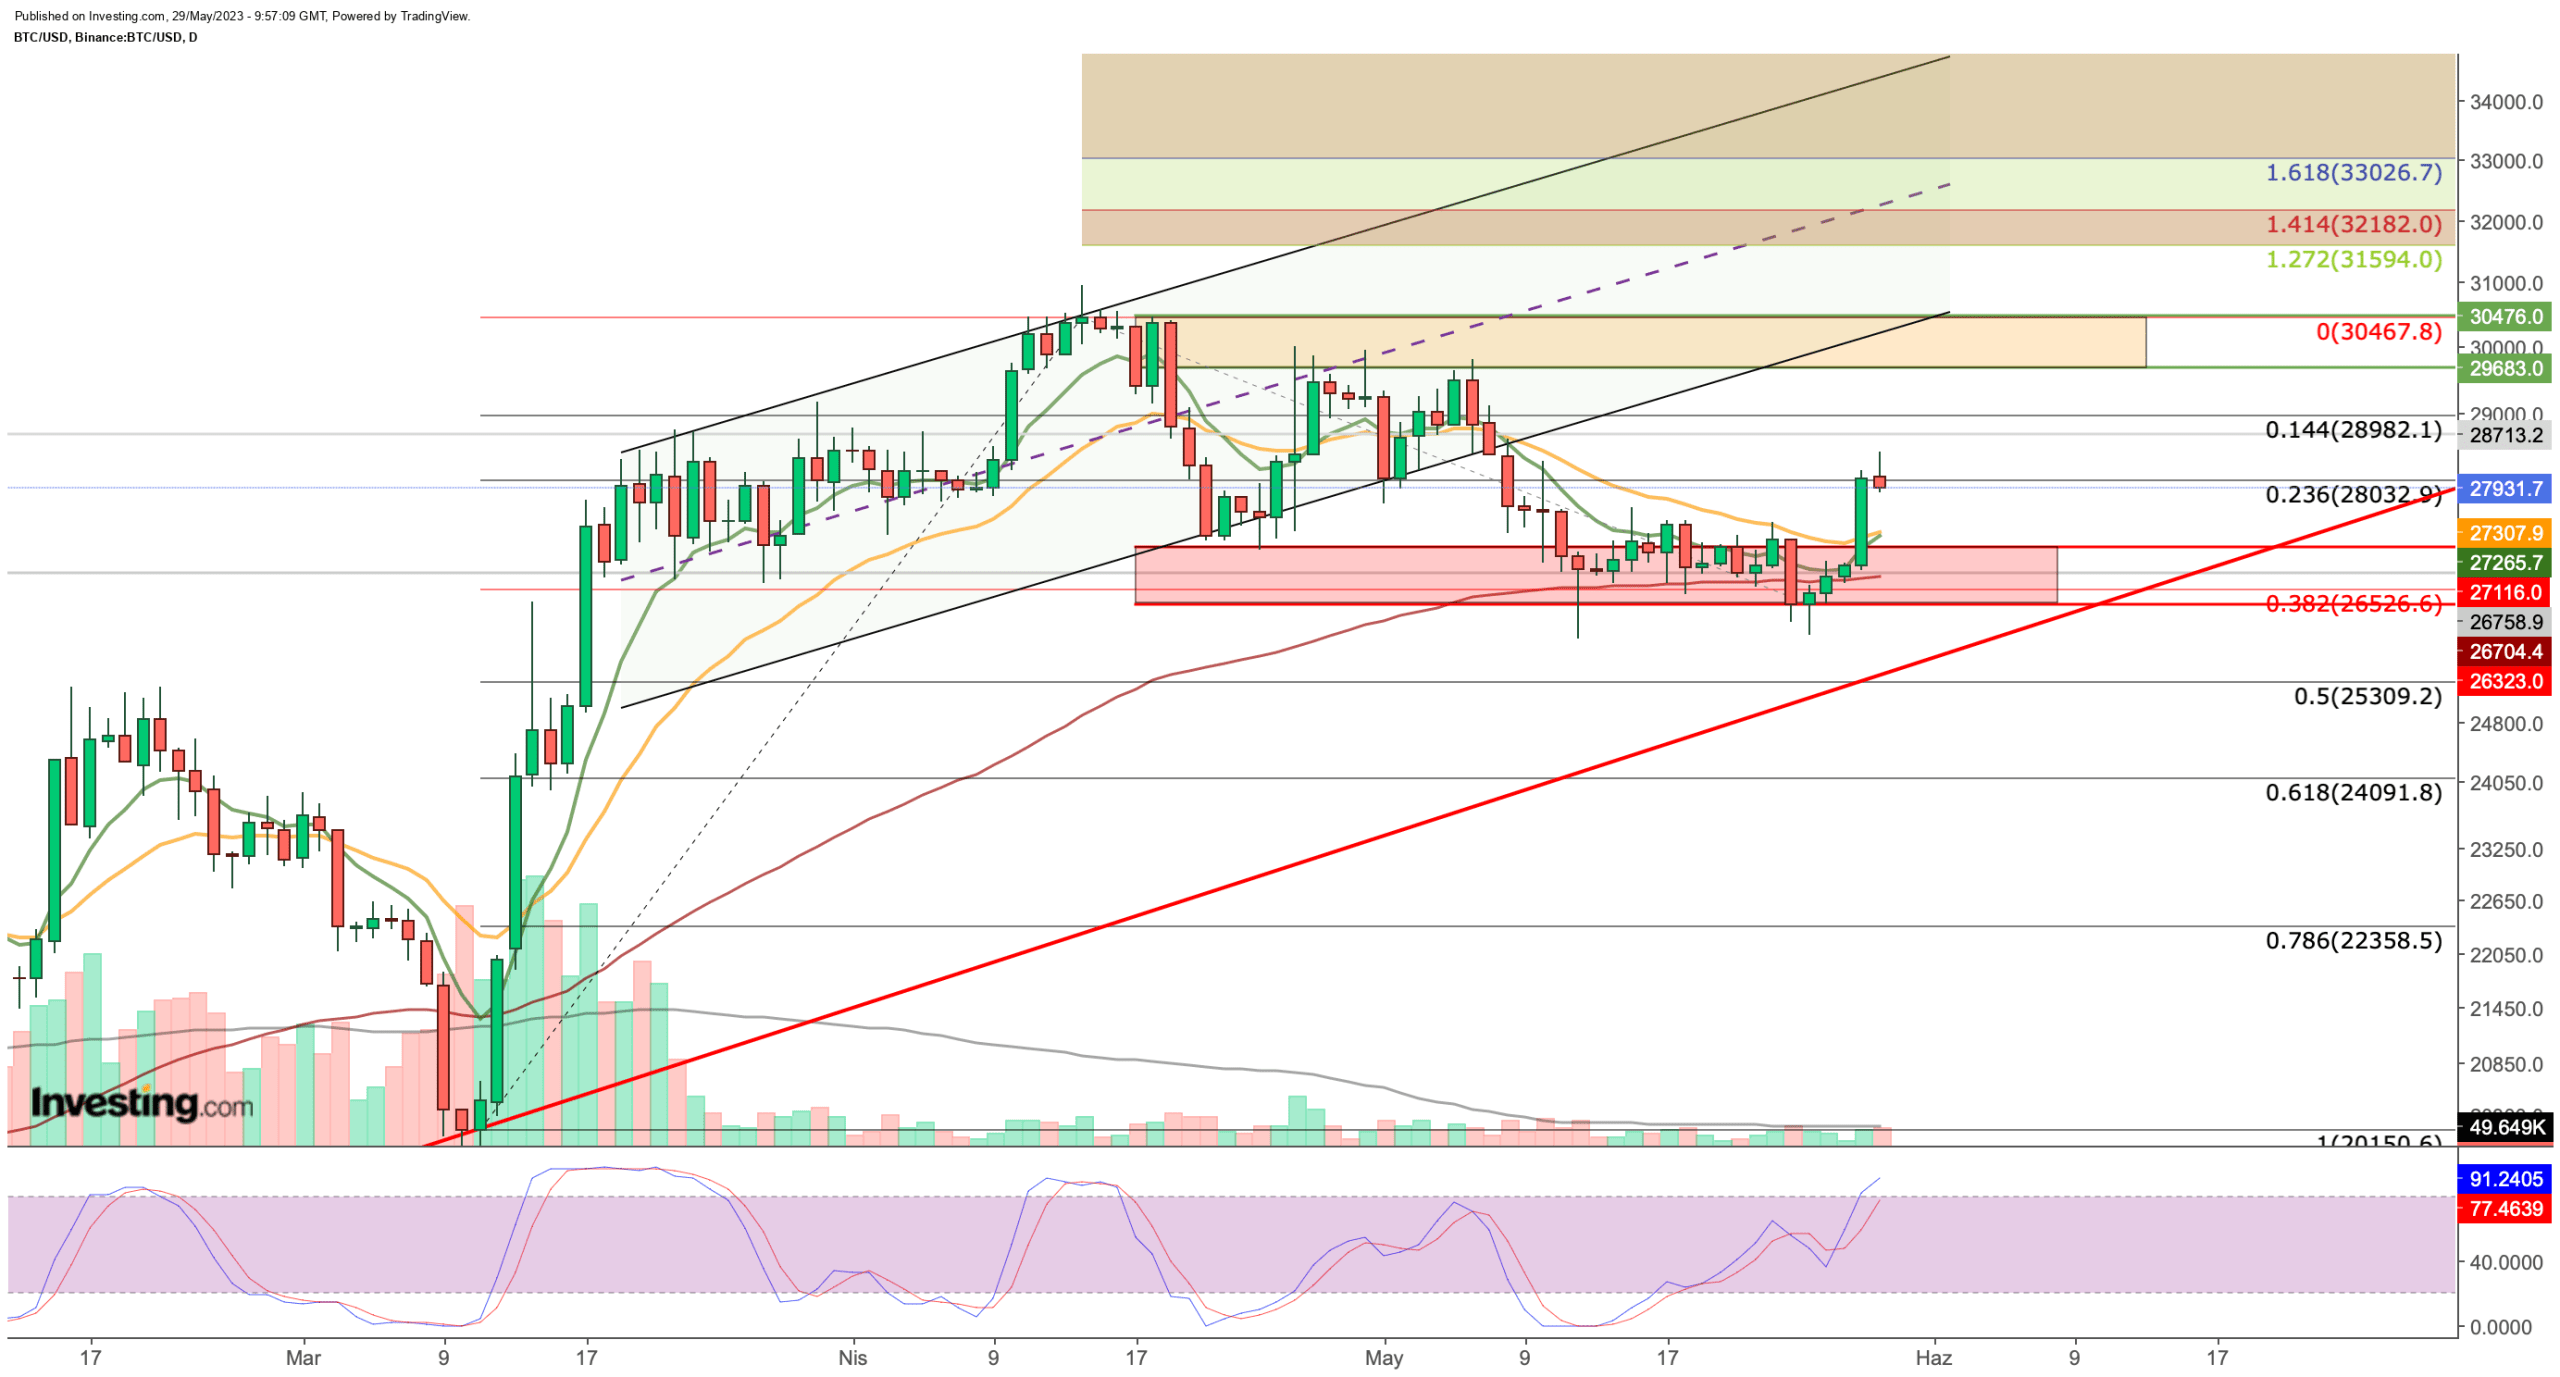
From a technical standpoint, Bitcoin initially held onto Fib 0.382 ($26,500) during the last uptrend and then retraced to Fib 0.236 ($28,000) during the subsequent bounce.
$28,000 a Critical Level for Bitcoin
 Bitcoin Daily Chart
Bitcoin is currently hovering near critical resistance at $28,000, and if it manages to close above this level, the next target could be $29,200 by the end of the day.
After crossing these two milestones, the focus will shift back to the resistance range of $29,600 to $30,500 from April.
If the positive sentiment persists, Bitcoin could potentially reach the range of $31,500 to $33,000.
Moreover, reclaiming the $30,000 level would indicate a re-establishment of the uptrend, potentially leading to significant rallies not only for Bitcoin but also for other cryptocurrencies.
On the other hand, if Bitcoin remains below $30,000, it could be a sign of a potential trend reversal. A move into this region would be considered a test for a return to the rising channel.
If buyers fail to push the price higher, it is likely that sellers will gain strength, and the support zone around $26,500 could weaken further.
In the event of a trend reversal, the target levels to watch would be $25,300, $24,000, and $22,350.
Looking at the moving averages, the exponential moving average (EMA) values, which turned downward in early May, are showing signs of turning up again with support from the 3-month average.
Therefore, it is crucial for Bitcoin to close above $28,000, as it would lead to the 8-day EMA crossing above the 21-day EMA, indicating a bullish signal.
The Stochastic RSI is also generating a bullish signal after displaying an indecisive pattern last week, thanks to yesterday’s bounce.
As a result, expect Bitcoin price to fluctuate near $27,300 this week, with a focus on a breakout above $28,000.
This week, the announcement of the nonfarm payrolls data on Friday is an important economic event to monitor.
It is likely that this data will cause volatility in cryptos to spike in the latter half of the week.
Ethereum Eyes $2000
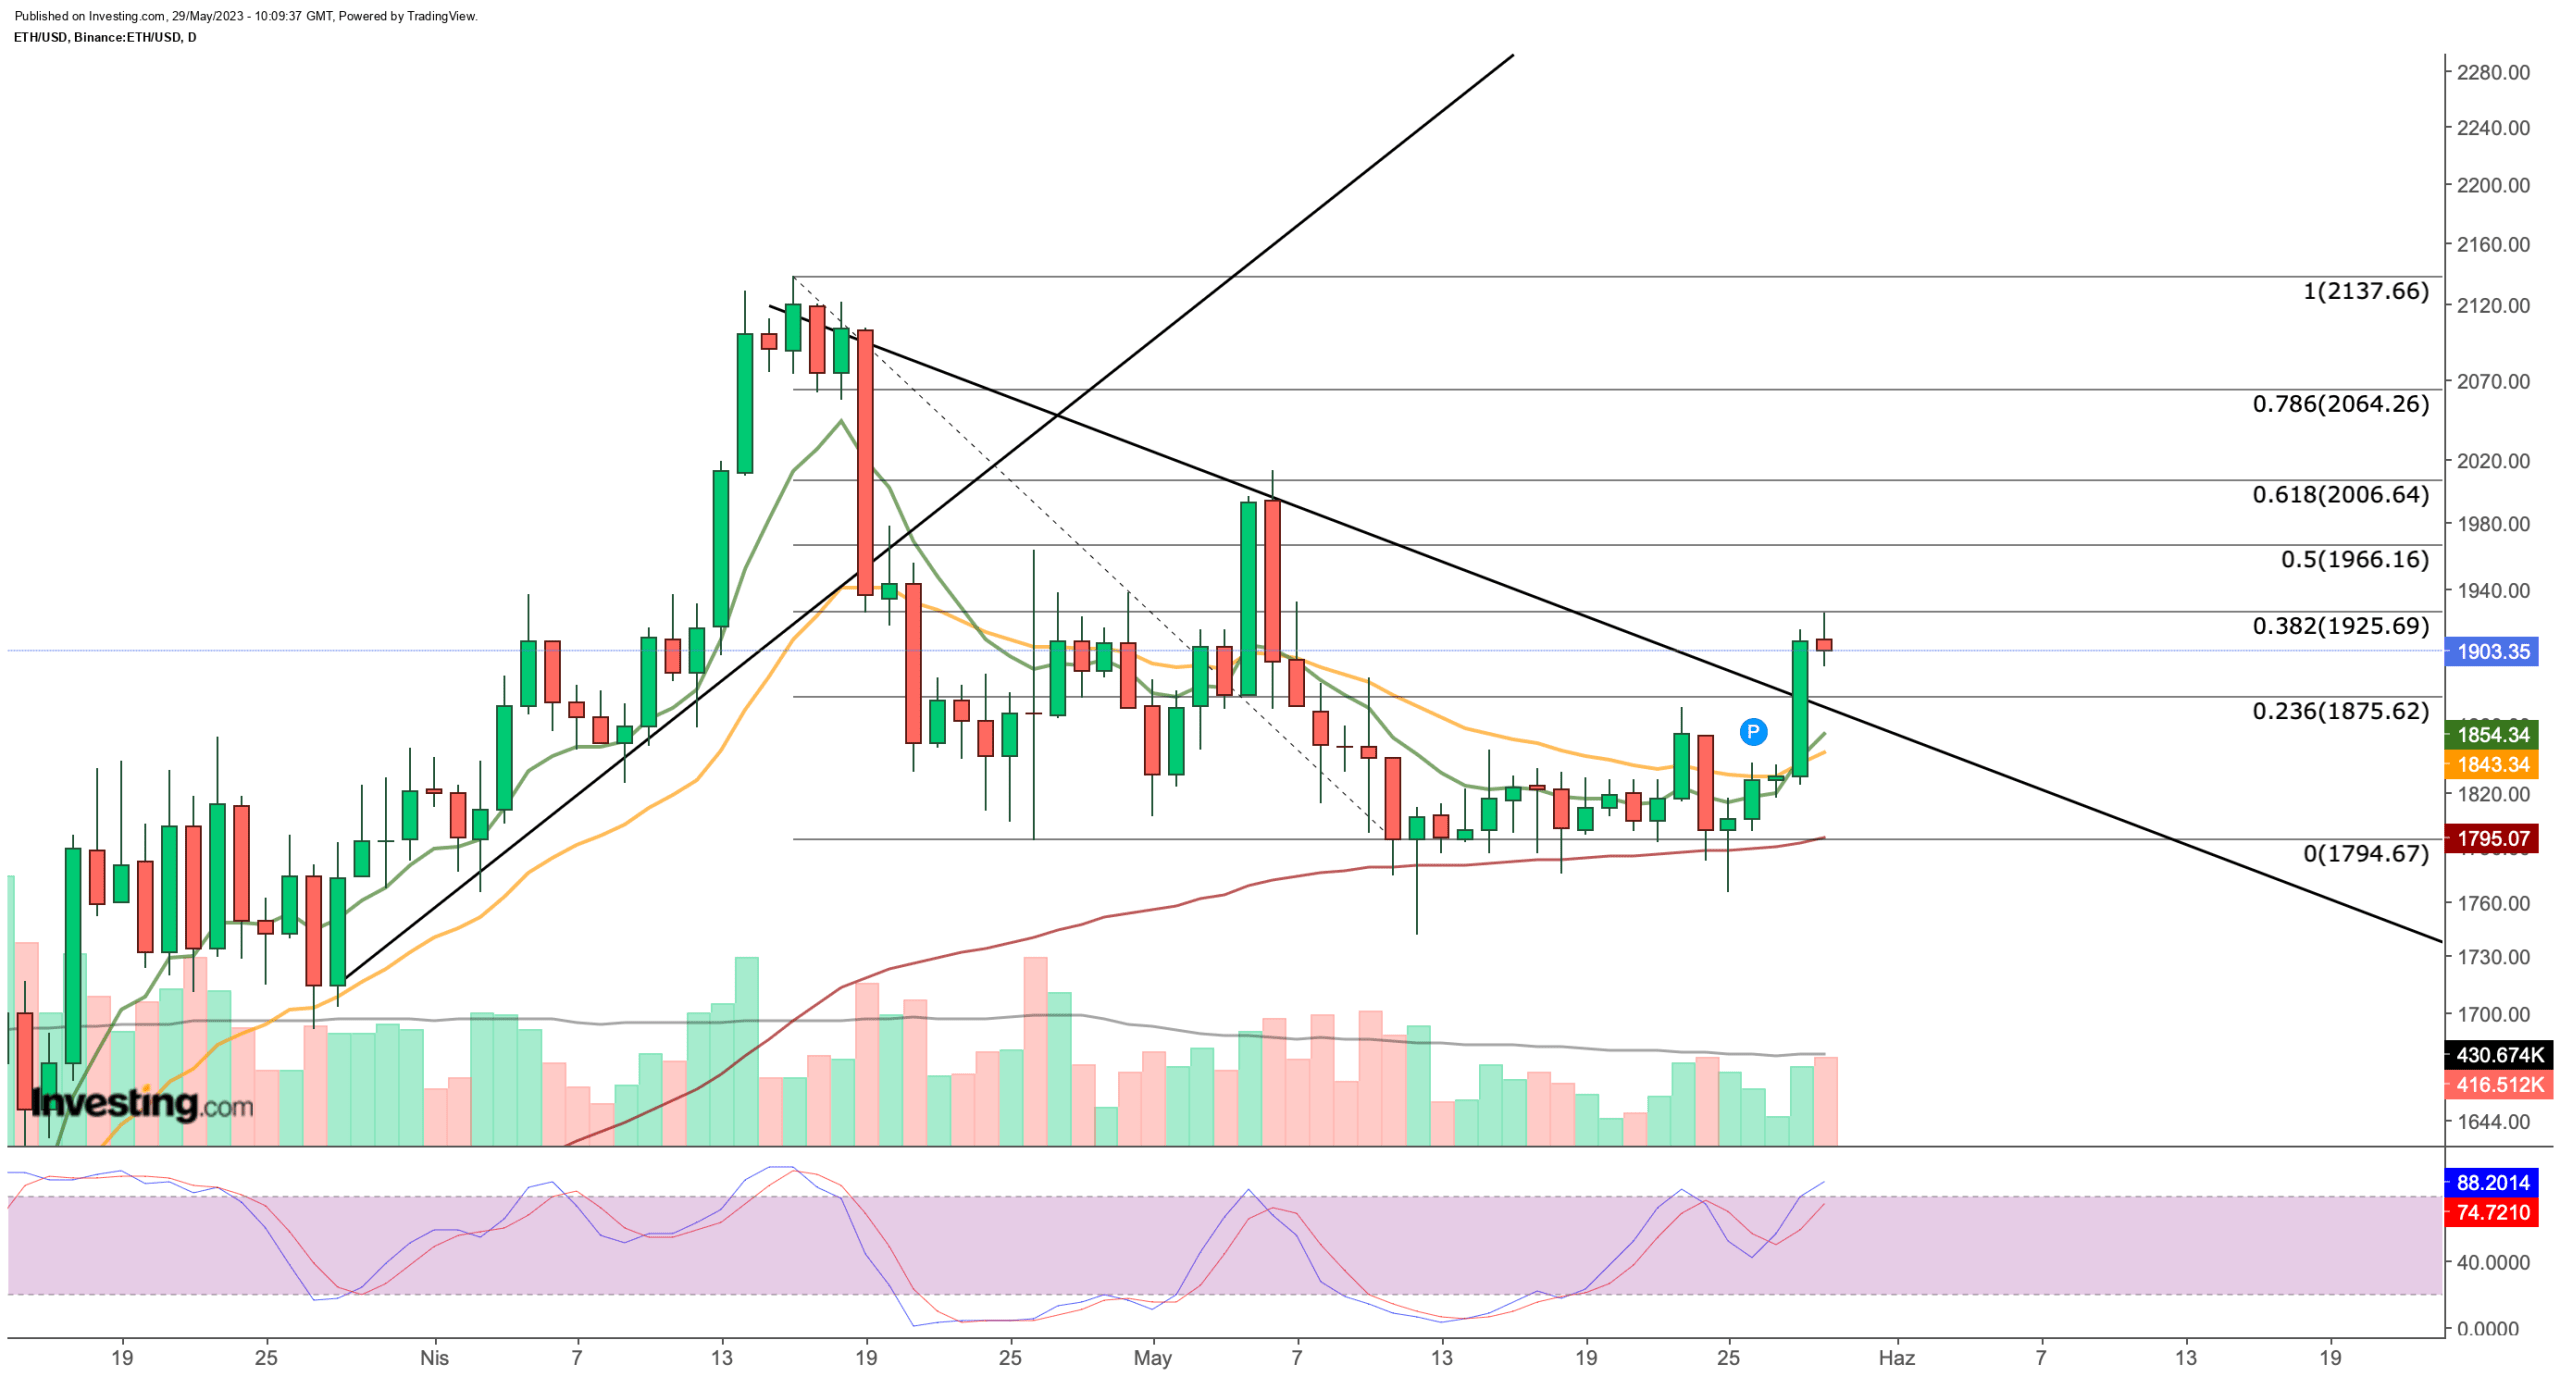
 ETH/USD Daily Chart
After finding support at around $1,800, Ethereum rallied, reaching $1,900. This broke the short-term downtrend that began in April from the $2,100 region.
ETH bulls will face difficulty in surpassing the initial resistance level of $1,925 (Fib0.382) unless the price remains above $1,875.
However, if the crypto breaks out, it could potentially drive toward $2,000. The next target for Ethereum could then be in the range of $2,060 to $2,130.
If Ethereum fails to surpass the $1,925 level this week, selling pressure could increase.
On the flip side, if buyers are unable to defend the $1,875 support, declines below $1,800 become more likely.
Consequently, traders should keep an eye on the $1,925 to $1,875 range today.
With InvestingPro, you can conveniently access comprehensive information and outlook on a company in one place, eliminating the need to gather data from multiple sources such as SEC filings, company websites, and market reports.
In addition to analyst targets, InvestingPro provides a single-page view of complete information, saving you time and effort.
Start your InvestingPro free 7-day trial now!
Find All the Info you Need on InvestingPro!
Disclaimer: This article was written for informational purposes only; it does not constitute a solicitation, offer, advice, counsel, or recommendation to invest, nor is it intended to encourage the purchase of assets in any way.
Source: Investing.com


