BTC/USD
-1.18%
Add to/Remove from Watchlist
Add to Watchlist
Add Position
Position added successfully to:
Please name your holdings portfolio
Type:
BUY
SELL
Date:
Amount:
Price
Point Value:
Leverage:
1:1
1:10
1:25
1:50
1:100
1:200
1:400
1:500
1:1000
Commission:
Create New Watchlist
Create
Create a new holdings portfolio
Add
Create
+ Add another position
Close
ETH/USD
-2.21%
Add to/Remove from Watchlist
Add to Watchlist
Add Position
Position added successfully to:
Please name your holdings portfolio
Type:
BUY
SELL
Date:
Amount:
Price
Point Value:
Leverage:
1:1
1:10
1:25
1:50
1:100
1:200
1:400
1:500
1:1000
Commission:
Create New Watchlist
Create
Create a new holdings portfolio
Add
Create
+ Add another position
Close
XRP/USD
-6.15%
Add to/Remove from Watchlist
Add to Watchlist
Add Position
Position added successfully to:
Please name your holdings portfolio
Type:
BUY
SELL
Date:
Amount:
Price
Point Value:
Leverage:
1:1
1:10
1:25
1:50
1:100
1:200
1:400
1:500
1:1000
Commission:
Create New Watchlist
Create
Create a new holdings portfolio
Add
Create
+ Add another position
Close
Bitcoin has traded within a narrow range between $30,000 and $31,500 for a month
The crypto may undergo another correction before eyeing higher levels
Meanwhile, Ethereum has found it difficult to surpass the $1,950 – $2,025 zone
Bitcoin has been trading within a relatively narrow range between $30,000 and $31,500 for about a month, indicating a prolonged period of consolidation. During this time, bulls and bears have been locked in a battle for control.
A similar situation occurred in March 2023, although it lasted for a shorter duration. The cryptocurrency exhibited increased volatility after remaining within the $26,000 to $28,000 range. It broke through the $30,000 mark but faced significant resistance in April. As selling pressure intensified, it dropped below $25,000 eventually.
After a mixed performance in April, it entered the summer months with a correction, declining due to the impact of macroeconomic data as the Federal Reserve continued to raise interest rates in May. The market also experienced a downturn following the SEC’s lawsuit against cryptocurrency exchanges in early June. However, the negative impact of the SEC’s actions was quickly overcome by positive news when BlackRock) filed for a spot ETF application.
Subsequently, with the Fed’s interest rate hike in June and the significant news of the ETF, the market returned to the $30,000 range, which is considered a psychological support level for cryptocurrencies. The focus now lies on how Bitcoin will break out of this consolidation phase.
Following last week’s release of US inflation data, attention has shifted to the Federal Reserve. Although headline inflation has shown a downward trend, core inflation remains stubbornly high, leading to expectations of a 25 basis point interest rate hike by the US Federal Reserve this month. The Fed’s interest rate is a crucial benchmark for risk markets, placing pressure on Bitcoin’s upward movement.
Moreover, the summer brings rising temperatures, potentially increasing mining costs. Additionally, the record-high mining difficulty for BTC has prompted miners to sell, creating another hurdle for Bitcoin’s progress in the cryptocurrency market, despite favorable conditions.
On a different note, the recent interim decision in favor of XRP/USD triggered a rally, but its impact on Bitcoin was limited. This event mainly affected the altcoin market. On the other hand, Bitcoin faced selling pressure when attempting to break the $31,500 resistance level, causing it to retreat to the lower end of the trading range and relinquish its recent gains.
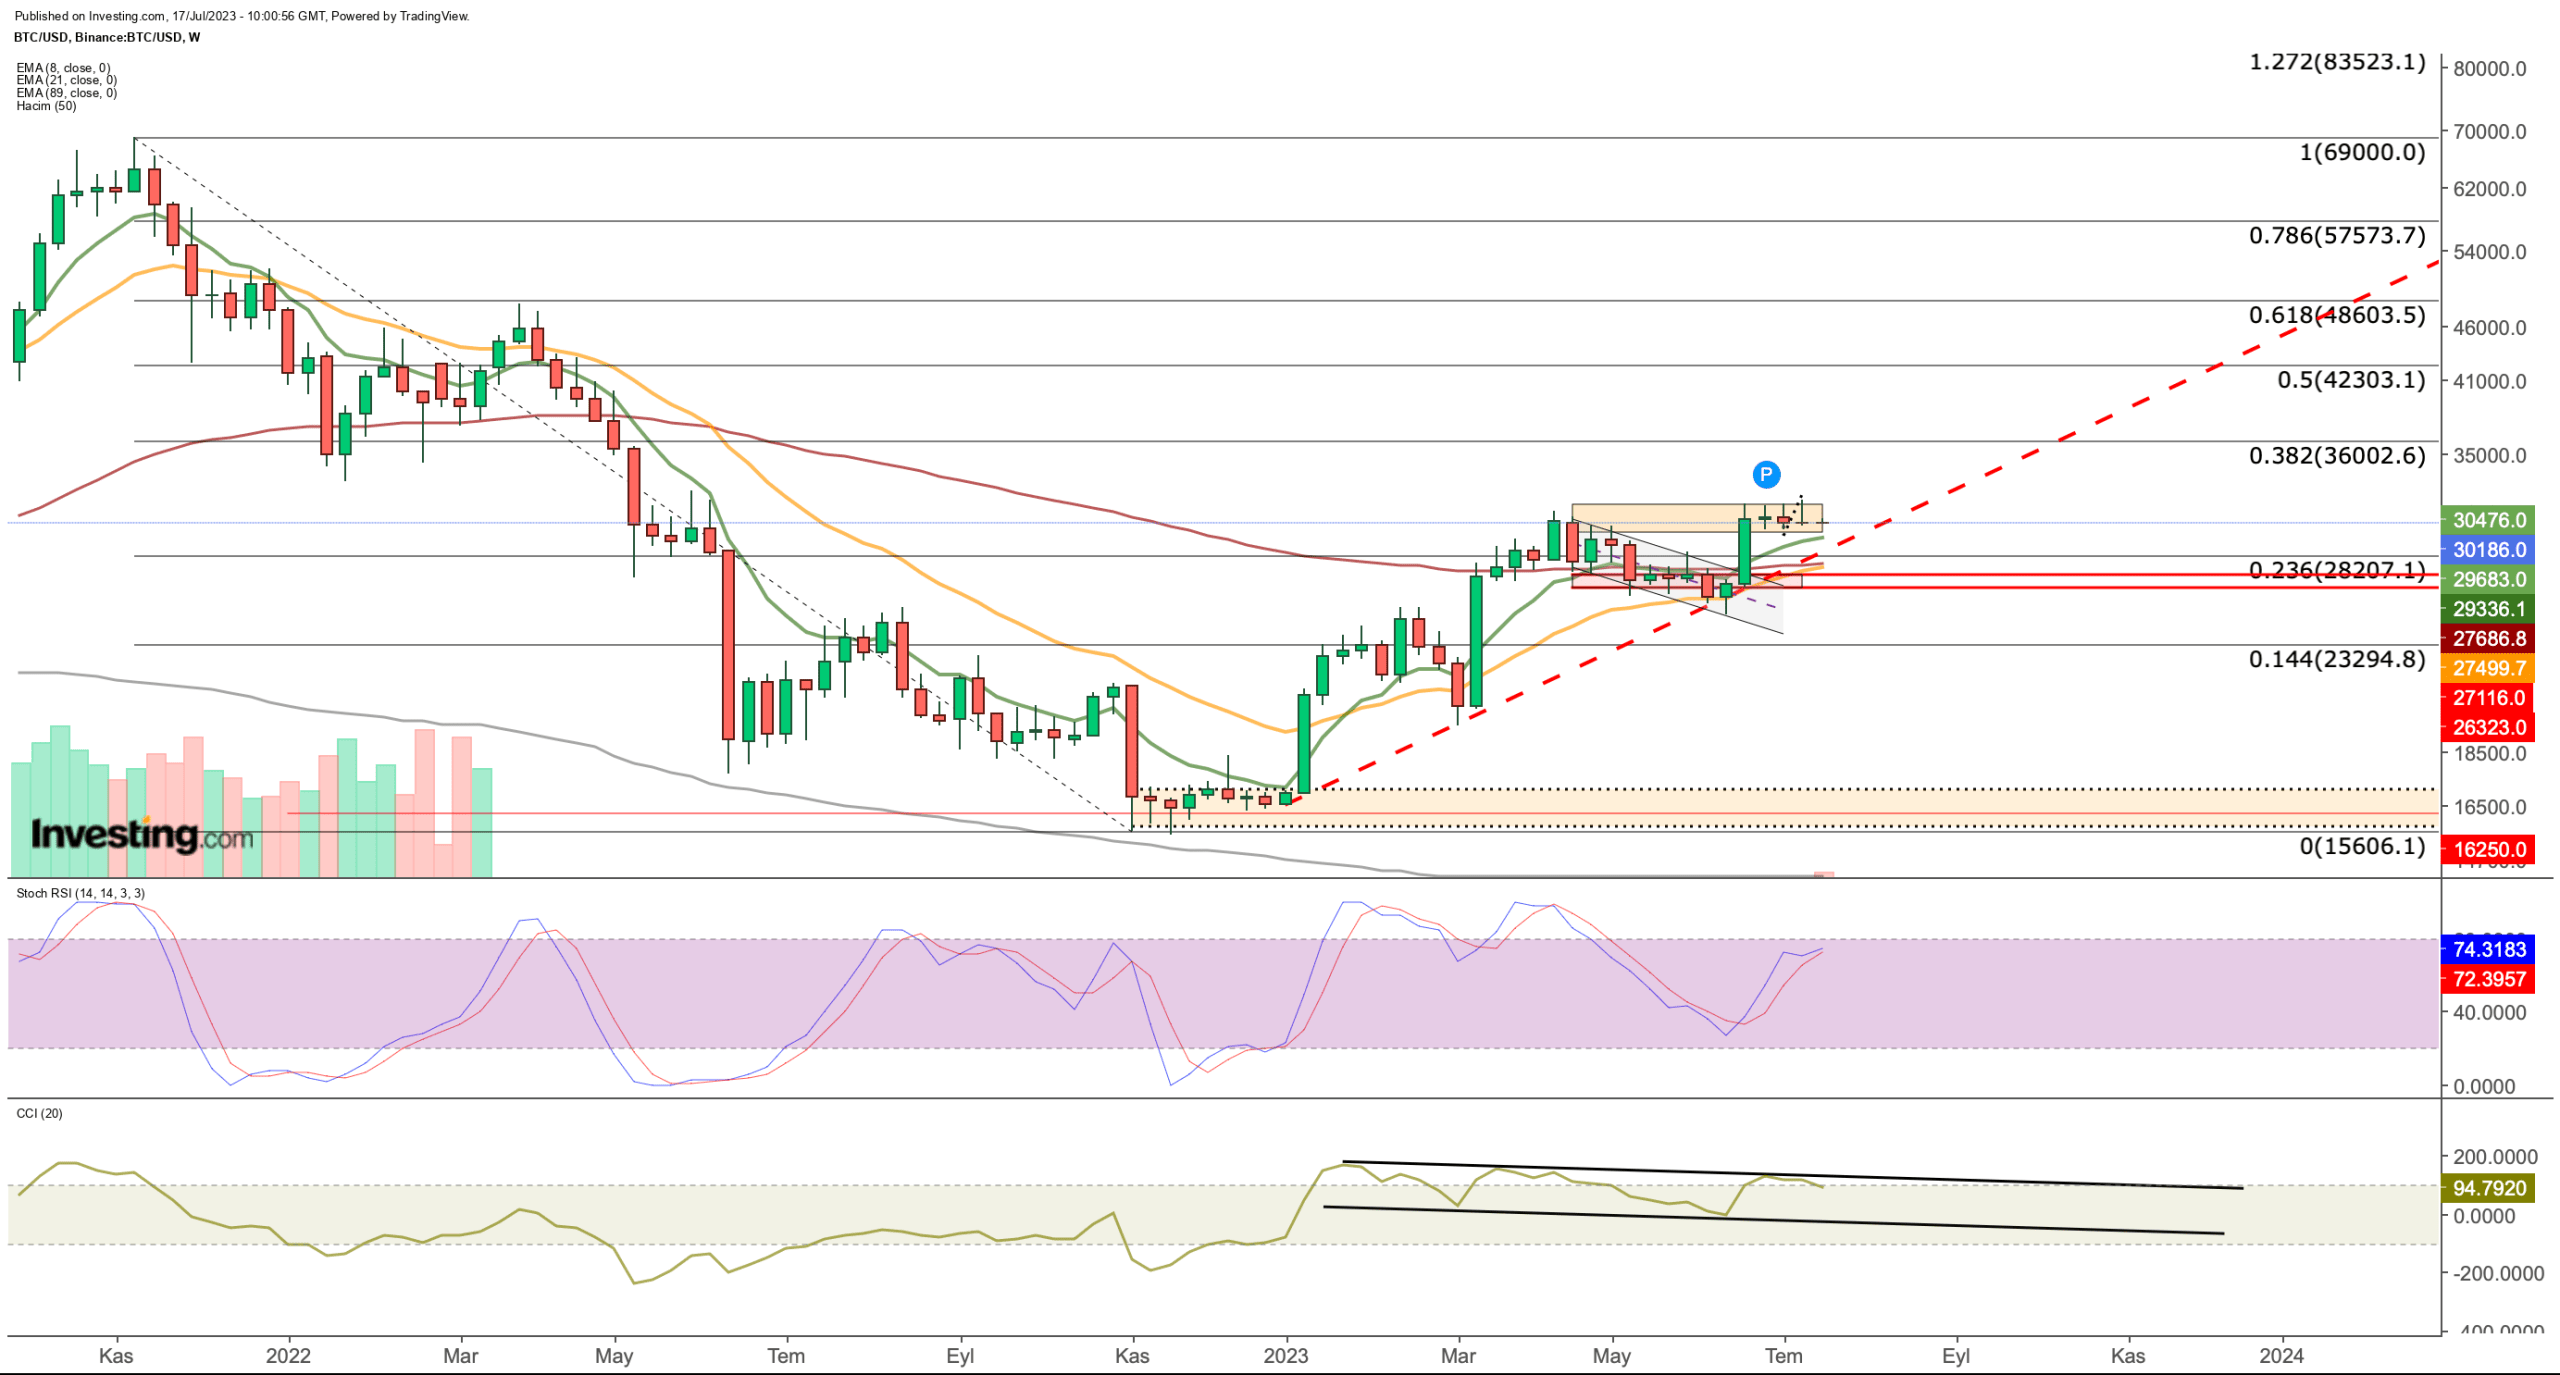
 Bitcoin Weekly Chart
Bitcoin is currently in a valid uptrend after recent positive developments drove prices up to $31,500. However, some technical indicators suggest that Bitcoin may undergo another correction before reaching higher levels.
The weekly outlook indicates a potential break of the uptrend line in the near future, leading to a test below $25,000. This could be attributed to a technical divergence with the bearish CCI indicator conflicting with the bullish price action. A similar discrepancy may also arise with the Stochastic RSI indicator unless Bitcoin manages to overcome the resistance at $31,000.
In terms of support and resistance levels, the current price action indicates the first support zone in the $29,700 – $29,900 range, aligning with the lower boundary of the horizontal channel. Below this level, a secondary support line can be observed at around $27,000.
On the upside, $31,500 remains a significant resistance level, while potential targets of $32,000, $34,000, and $36,000 may come into focus if there is a further increase in demand. However, if Bitcoin daily closes below $31,500, it raises the risk of entering a corrective trend that could extend below $25,000.
Ethereum Outlook
Ethereum underwent a notable correction from April to June, reaching as low as $1,600. While this downturn affected ETH’s bullish momentum for 2023, cryptocurrency continues to follow the broader trend.
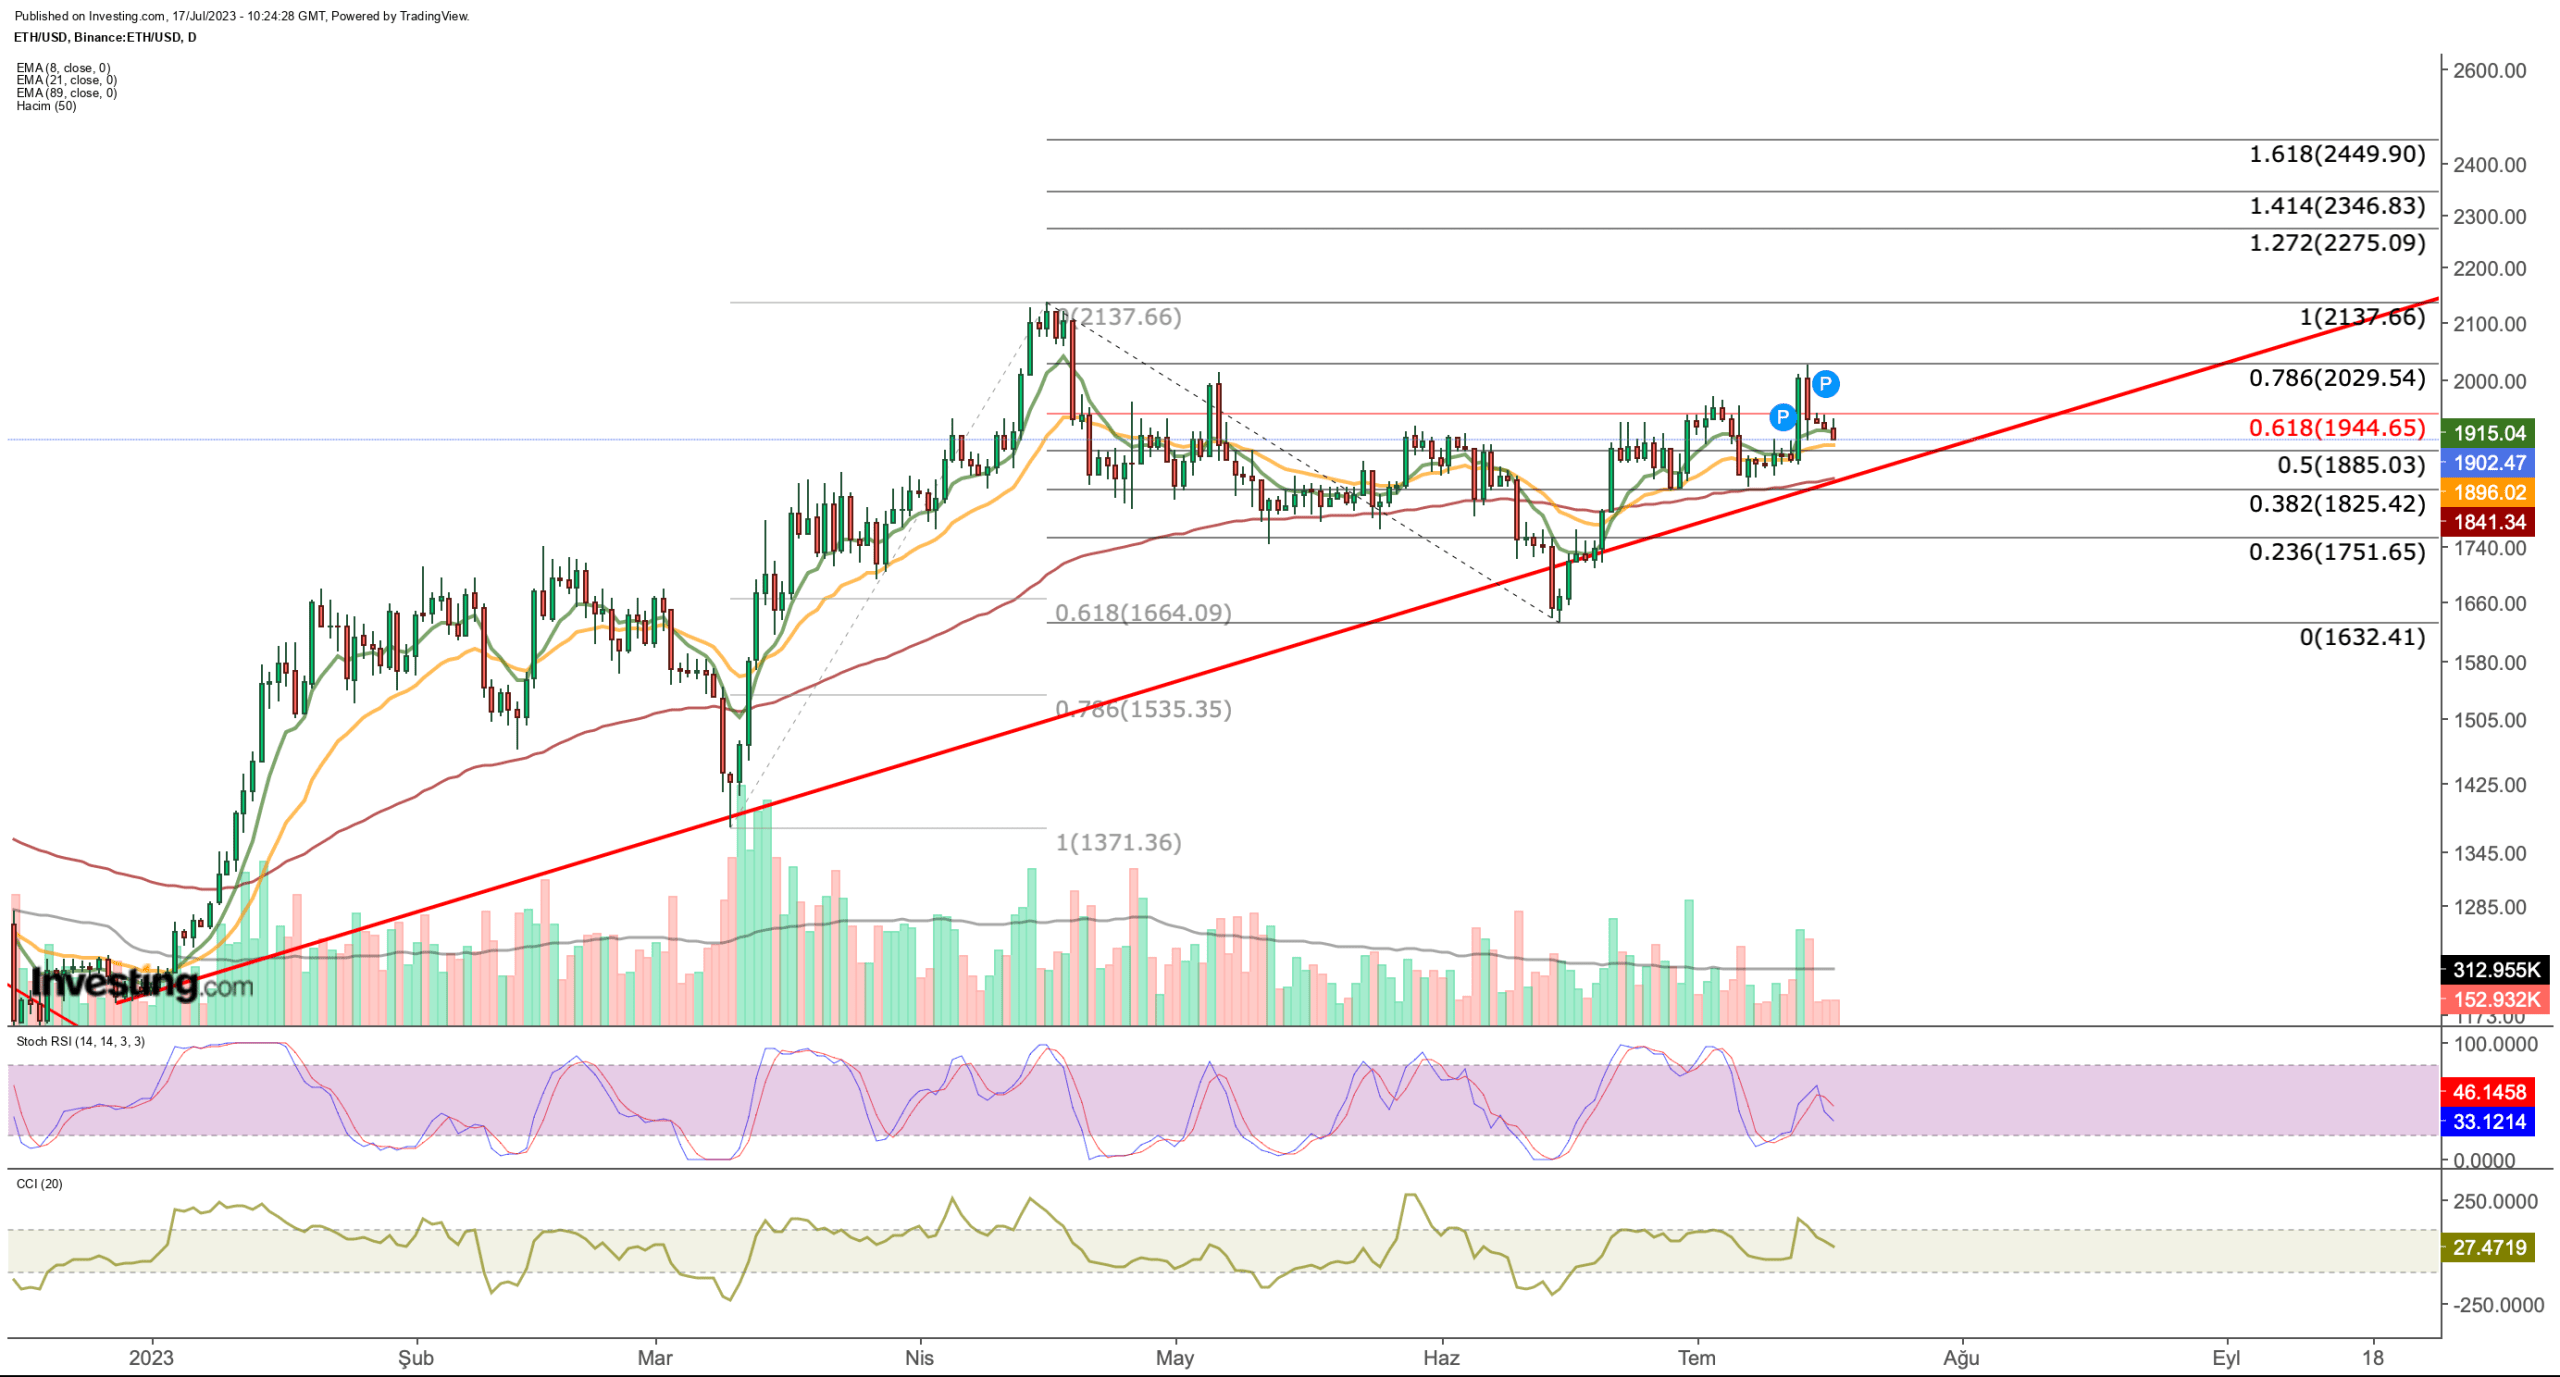
 Ethereum Daily Chart
ETH found it challenging to surpass the resistance zone between $1,950 and $2,025. This week, monitoring the support level within the range of $1,900 to $1,915 will be crucial. A breach below this region may lead to a decline towards $1,840, with further downside potential towards the $1,700 mark.
On the upside, confirmation of a daily closing price above $2,030 would be significant. If this scenario unfolds, Ethereum could potentially continue its upward momentum, targeting the range of $2,275 to $2,450, surpassing the previous peak in April at $2,135.
***
Access first-hand market data, factors affecting stocks, and comprehensive analysis. Take advantage of this opportunity by subscribing and unlocking the potential of InvestingPro to enhance your investment decisions.
And now, you can purchase the subscription at a fraction of the regular price. Our exclusive summer discount sale has been extended!
InvestingPro is back on sale!
Enjoy incredible discounts on our subscription plans:
Monthly: Save 20% and get the flexibility of a month-to-month subscription.
Annual: Save an amazing 50% and secure your financial future with a full year of InvestingPro at an unbeatable price.
Bi-Annual (Web Special): Save an amazing 52% and maximize your profits with our exclusive web offer.
Don’t miss this limited-time opportunity to access cutting-edge tools, real-time market analysis, and expert opinions.
Join InvestingPro today and unleash your investment potential. Hurry, the Summer Sale won’t last forever!
Summer Sale Is Live Again!
Disclaimer: This article is written for informational purposes only; it is not intended to encourage the purchase of assets in any way, nor does it constitute a solicitation, offer, recommendation, advice, counseling, or recommendation to invest. We remind you that all assets are considered from different perspectives and are extremely risky, so the investment decision and the associated risk are the investors’.
Source: Investing.com


