US500
+0.18%
Add to/Remove from Watchlist
Add to Watchlist
Add Position
Position added successfully to:
Please name your holdings portfolio
Type:
BUY
SELL
Date:
Amount:
Price
Point Value:
Leverage:
1:1
1:10
1:25
1:50
1:100
1:200
1:400
1:500
1:1000
Commission:
Create New Watchlist
Create
Create a new holdings portfolio
Add
Create
+ Add another position
Close
VIX
-0.30%
Add to/Remove from Watchlist
Add to Watchlist
Add Position
Position added successfully to:
Please name your holdings portfolio
Type:
BUY
SELL
Date:
Amount:
Price
Point Value:
Leverage:
1:1
1:10
1:25
1:50
1:100
1:200
1:400
1:500
1:1000
Commission:
Create New Watchlist
Create
Create a new holdings portfolio
Add
Create
+ Add another position
Close
The volatility index is so low it has to go higher eventually. Such seems obvious, but this year, despite the banking crisis, higher interest rates, and slowing economic data, investors continue to abandon hedges amid bullish optimism.
But what exactly is the volatility index, more commonly called the “VIX,” and why does it matter?
“The Cboe Volatility Index (VIX) is a real-time index representing the market’s expectations for the relative strength of the S&P 500 Index (SPX) near-term price changes. Because it is derived from the prices of SPX index options with near-term expiration dates, it generates a 30-day forward projection of volatility. Volatility, or how fast prices change, is often seen as a way to gauge market sentiment, particularly the degree of fear among market participants.
It is an important index in the world of trading and investment because it provides a quantifiable measure of market risk and investors’ sentiment.” – Investopedia
Investors view the “VIX” as a gauge of investor “greed” or “fear.” Given that investors tend to be wrong at extremes, such has been an excellent leading indicator of a reversal when the index reflects extreme fear or greed. Since there is an inverse relationship between the volatility index (VIX) and investor sentiment, the chart below inverts the VIX index for a better comparison. Unsurprisingly, low VIX readings correlate to investor bullishness.
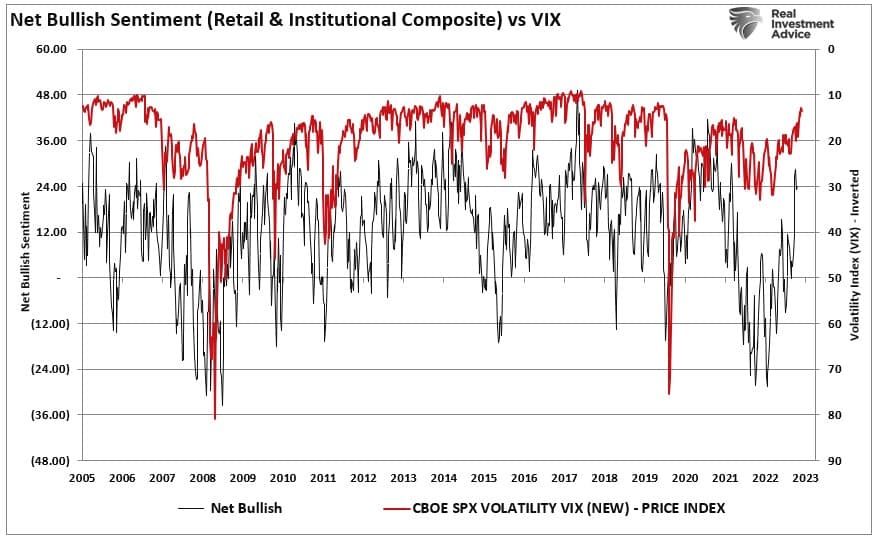 Net Bullish Sentiment vs VIX
To understand the relationship to the market, we created a composite index. The index combines retail and institutional investors’ net bullish sentiment and an inverted volatility index (1 minus the VIX reading). We overlaid the composite index against the S&P 500 index. Unsurprisingly, high index readings regularly associated with market events and corrections. Low readings occur near market lows.
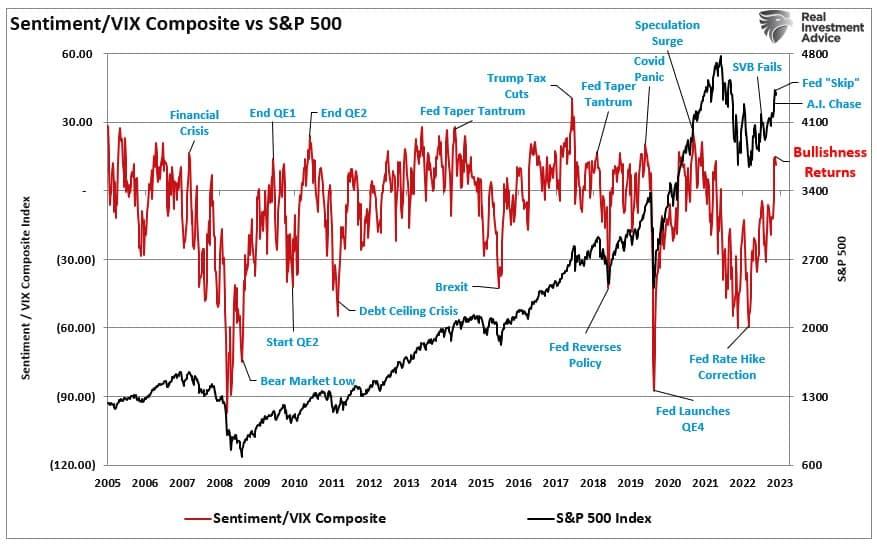 Sentiment and VIX Composite vs S&P 500
Investors should expect a correction with the combined index readings approaching higher levels. However, as Nick Colas recently stated, these periods can last longer than expected.
“Once we’re in a [low-volatility] regime, it tends to last unless a true ‘unknown unknown’ comes along. With the VIX well below average now, we look to be in a low-vol/good return environment until a genuine shock comes along. It is hard, but not impossible, to ‘surprise’ the VIX with new information that switches it from running below to suddenly above trend.
This is not a bright green light for further equity gains in 2023, but it does set the bar quite high regarding what sort of catalyst is needed to derail the current rally.”
Notably, his point is that stability ultimately breeds instability.
Stability Breads Instability
Economist Hyman Minsky argued there is an inherent instability in financial markets. During periods of bullish speculation, the excesses generated by reckless, speculative activity will eventually lead to a crisis. Of course, the longer the speculation occurs, the more severe the crisis will be.
We can visualize these periods of “instability” by examining the Volatility Index versus the S&P 500 index. Note that long periods of “stability” with regularity lead to periods of “instability.”
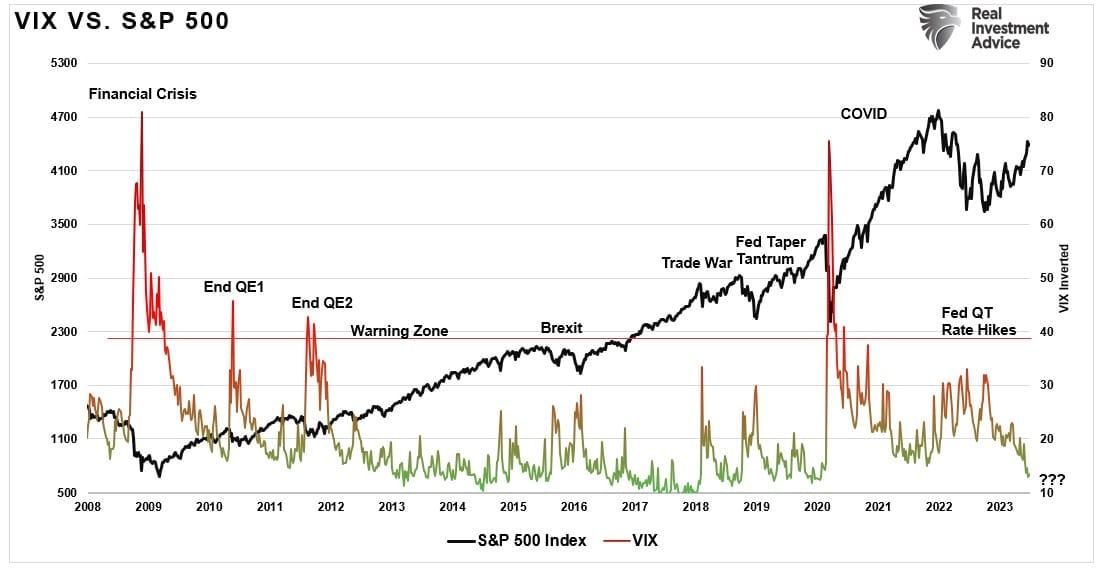 VIX Vs. SP500Given the volatility index is a function of the options market, we can also view these alternating periods of “stability/instability.” The chart below shows the daily price changes of the index itself.
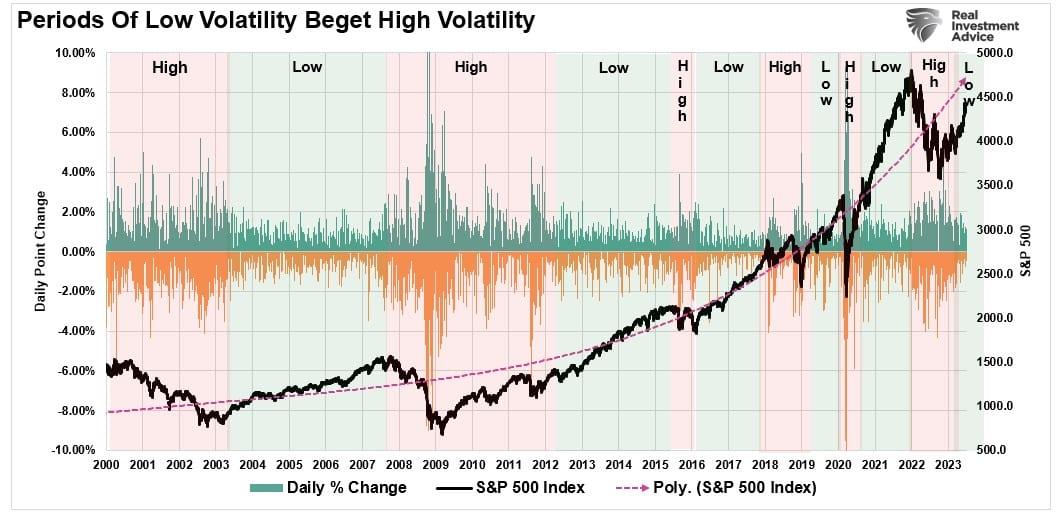 SP500 vs Daily Price Changes Full HistoryWith the entirety of the financial ecosystem more heavily leveraged than ever, the “instability of stability” is now the most significant risk.
The “stability/instability paradox” assumes that all players are rational. Therefore, such rationality implies avoidance of destruction. In other words, all players will act rationally, and no one will push “the big red button.”
The Fed depends on “everyone acting rationally” as they continue to hike rates to combat inflationary pressures. So far, the markets have compiled by absorbing financial events in stride and pushing asset prices higher. However, with the most aggressive rate hike campaign since the late 70s proceeding, the market largely ignores the risk of “something breaking” as bullish exuberance returns. Historically, bullish sentiment rises DURING the rate hiking campaign but ends poorly.
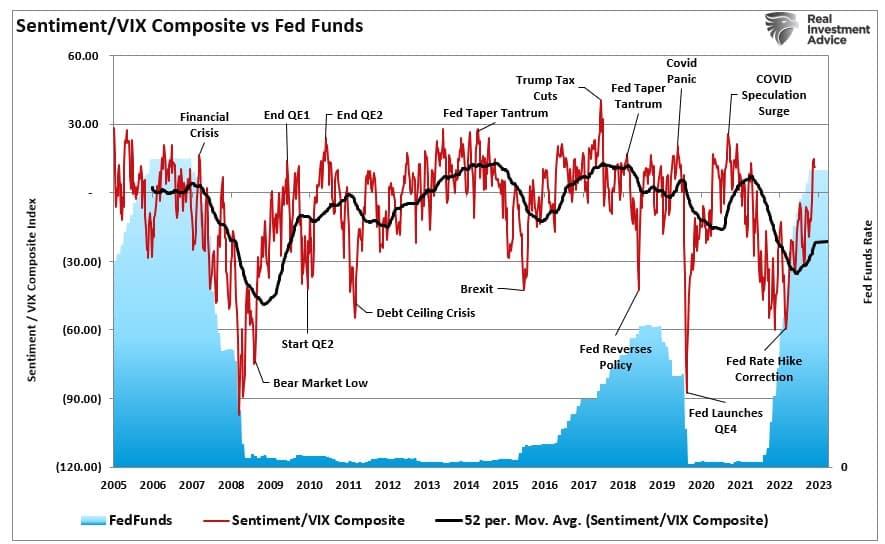 Fed Funds Vs Sentiment VIX index
The hope, as always, is this time will be different.
0DTE (Zero Days To Expiration)
While volatility is low currently, it is unlikely that volatility has been permanently suppressed. There is a decent correlation between volatility and the Fed’s rate-hiking campaign. Given that rate hikes eventually “break something,” particularly given the impact of higher borrowing costs on an increasingly leveraged economy, this time is likely no different. However, there is undoubtedly a lag effect between volatility and rate hikes, suggesting a recession remains a key risk.
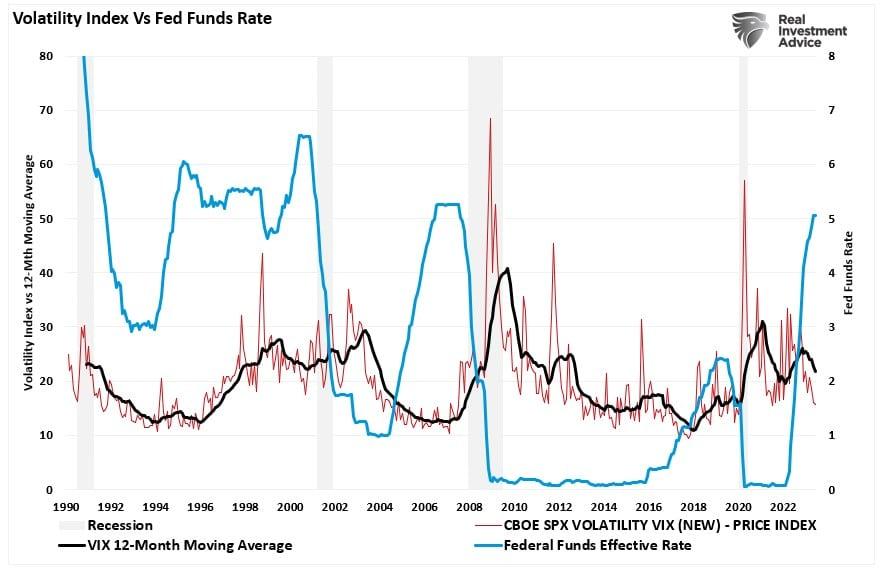 Volatility Index Vs Fed Funds Rate
Notably, while investors are becoming exceedingly complacent about a continued low volatility environment, they may be walking into a trap. Unfortunately, investors never know with certainty until the “trap is sprung.”
One reason supporting the claim that “the VIX is broken” is the rise of short-term options termed “0DTE” or “Zero Days To Expiration.” These extremely short-term put-and-call options on individual stocks and indexes expire within 24 hours. As the chart shows, almost half of the options volume on the S&P 500 is 0DTE. Such dwarfs the single-digit rates existing before the pandemic.
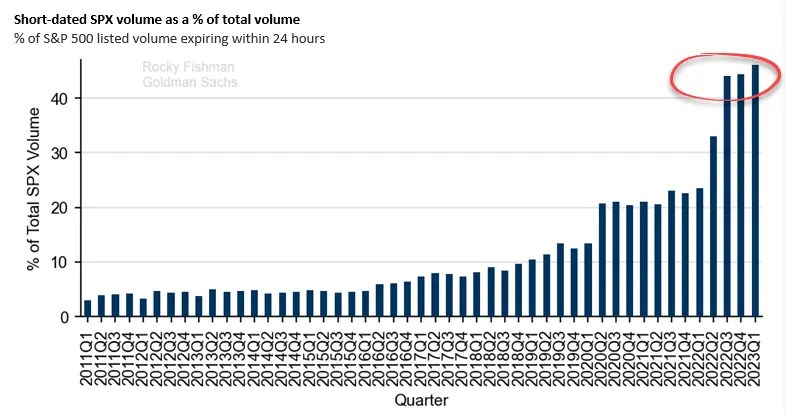 Short-Dated SPX Volume
More importantly, the traditional measure of “fear and greed” in the financial markets, the VIX, does not consider these 0DTE options.
“The risk from 0DTE (in our view) comes from a heavy imbalance (ex: too many non-hedgers short downside). We think a lot of 0DTE is one dynamic-hedger trading with another dynamic hedger, and/or underlying replacement (i.e., buy calls instead of long stock).” – SpotGamma.
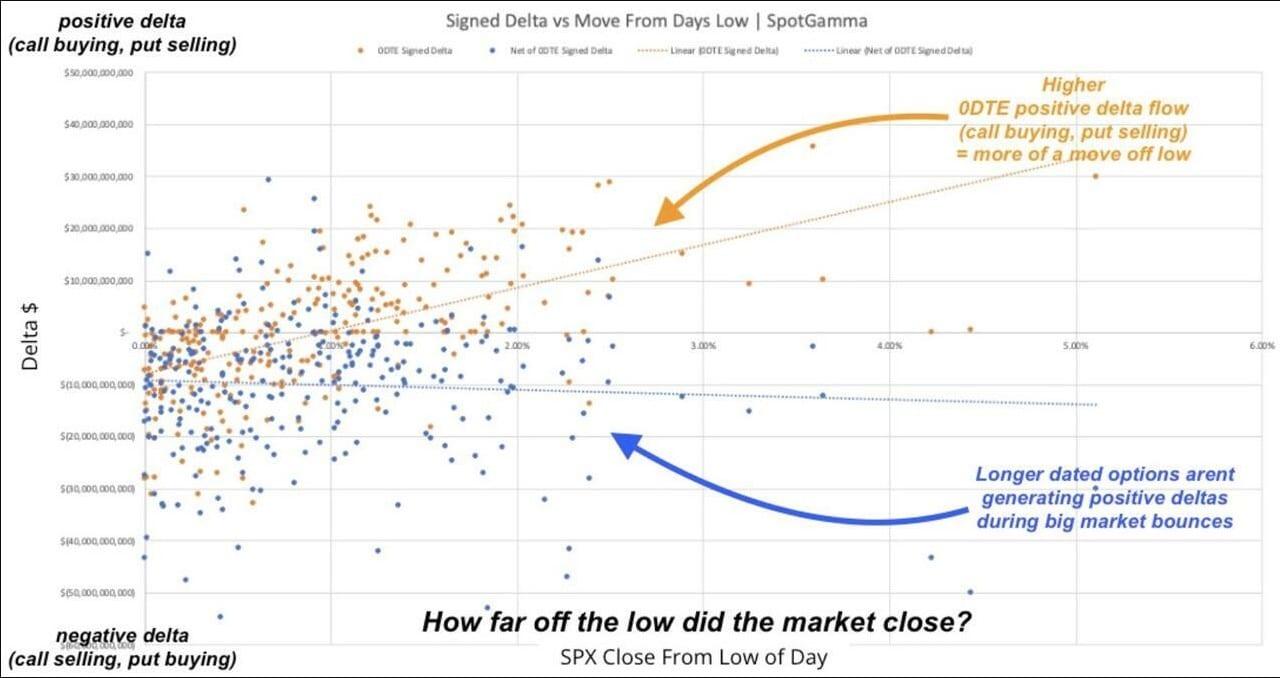 0DTE Options Puts and Calls
It is certainly possible the rise of 0DTE options may be contributing to the suppression of the volatility index, making it appear to be less effective near term. However, we won’t know with certainty until the next “volatility event” arrives. Unfortunately, it could be too late for many investors to do much about risk management.
But as our analysis shows, we suspect the VIX is working probably as it is a function of bullish market sentiment. While such suggests the market can, and likely will, go higher in the near term, it is also the fuel needed for the subsequent decline.
All that is missing is the unexpected, exogenous event that sparks the first wave of selling.
Source: Investing.com


