US500
+0.31%
Add to/Remove from Watchlist
Add to Watchlist
Add Position
Position added successfully to:
Please name your holdings portfolio
Type:
BUY
SELL
Date:
Amount:
Price
Point Value:
Leverage:
1:1
1:10
1:25
1:50
1:100
1:200
1:400
1:500
1:1000
Commission:
Create New Watchlist
Create
Create a new holdings portfolio
Add
Create
+ Add another position
Close
MSFT
-0.66%
Add to/Remove from Watchlist
Add to Watchlist
Add Position
Position added successfully to:
Please name your holdings portfolio
Type:
BUY
SELL
Date:
Amount:
Price
Point Value:
Leverage:
1:1
1:10
1:25
1:50
1:100
1:200
1:400
1:500
1:1000
Commission:
Create New Watchlist
Create
Create a new holdings portfolio
Add
Create
+ Add another position
Close
GOOGL
+0.65%
Add to/Remove from Watchlist
Add to Watchlist
Add Position
Position added successfully to:
Please name your holdings portfolio
Type:
BUY
SELL
Date:
Amount:
Price
Point Value:
Leverage:
1:1
1:10
1:25
1:50
1:100
1:200
1:400
1:500
1:1000
Commission:
Create New Watchlist
Create
Create a new holdings portfolio
Add
Create
+ Add another position
Close
AAPL
-0.13%
Add to/Remove from Watchlist
Add to Watchlist
Add Position
Position added successfully to:
Please name your holdings portfolio
Type:
BUY
SELL
Date:
Amount:
Price
Point Value:
Leverage:
1:1
1:10
1:25
1:50
1:100
1:200
1:400
1:500
1:1000
Commission:
Create New Watchlist
Create
Create a new holdings portfolio
Add
Create
+ Add another position
Close
AMZN
+0.18%
Add to/Remove from Watchlist
Add to Watchlist
Add Position
Position added successfully to:
Please name your holdings portfolio
Type:
BUY
SELL
Date:
Amount:
Price
Point Value:
Leverage:
1:1
1:10
1:25
1:50
1:100
1:200
1:400
1:500
1:1000
Commission:
Create New Watchlist
Create
Create a new holdings portfolio
Add
Create
+ Add another position
Close
IXIC
+0.11%
Add to/Remove from Watchlist
Add to Watchlist
Add Position
Position added successfully to:
Please name your holdings portfolio
Type:
BUY
SELL
Date:
Amount:
Price
Point Value:
Leverage:
1:1
1:10
1:25
1:50
1:100
1:200
1:400
1:500
1:1000
Commission:
Create New Watchlist
Create
Create a new holdings portfolio
Add
Create
+ Add another position
Close
META
-2.43%
Add to/Remove from Watchlist
Add to Watchlist
Add Position
Position added successfully to:
Please name your holdings portfolio
Type:
BUY
SELL
Date:
Amount:
Price
Point Value:
Leverage:
1:1
1:10
1:25
1:50
1:100
1:200
1:400
1:500
1:1000
Commission:
Create New Watchlist
Create
Create a new holdings portfolio
Add
Create
+ Add another position
Close
GOOG
+0.68%
Add to/Remove from Watchlist
Add to Watchlist
Add Position
Position added successfully to:
Please name your holdings portfolio
Type:
BUY
SELL
Date:
Amount:
Price
Point Value:
Leverage:
1:1
1:10
1:25
1:50
1:100
1:200
1:400
1:500
1:1000
Commission:
Create New Watchlist
Create
Create a new holdings portfolio
Add
Create
+ Add another position
Close
SNAP
-0.70%
Add to/Remove from Watchlist
Add to Watchlist
Add Position
Position added successfully to:
Please name your holdings portfolio
Type:
BUY
SELL
Date:
Amount:
Price
Point Value:
Leverage:
1:1
1:10
1:25
1:50
1:100
1:200
1:400
1:500
1:1000
Commission:
Create New Watchlist
Create
Create a new holdings portfolio
Add
Create
+ Add another position
Close
Microsoft, Alphabet, Meta Platforms, and Amazon report earnings next week, with Apple scheduled for the following week.
‘FAAMG’ profit, revenue growth, guidance updates will be the next test for the ongoing market rally.
Here’s what to watch for when the Big Five mega-cap tech stocks release their upcoming results.
Wall Street’s second-quarter earnings season shifts into high gear next week with some of the biggest names in the market set to release financial results. With the S&P 500 and Nasdaq Composite hovering near their best level in 15 months, most of the focus will once again be on the ‘Big 5’ group of mega-cap companies.
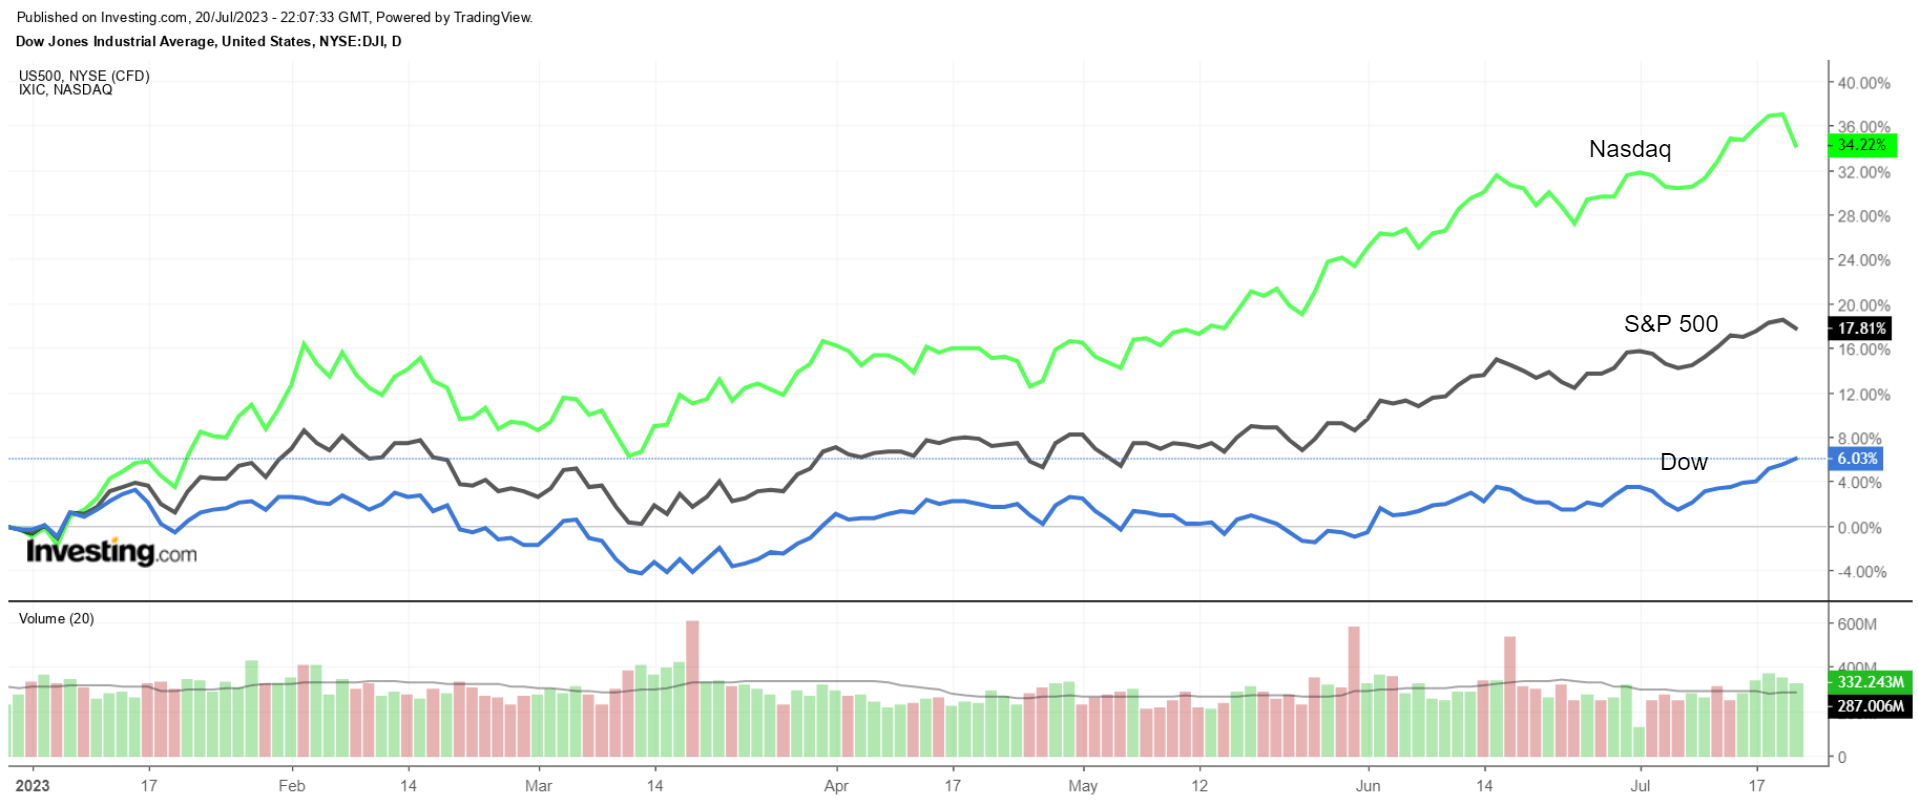 Dow, S&P 500, Nasdaq YTD Chart
Microsoft (NASDAQ:MSFT), Alphabet (NASDAQ:GOOGL) (NASDAQ:GOOG), Meta Platforms (NASDAQ:META), Amazon (NASDAQ:AMZN), and Apple (NASDAQ:AAPL) earnings will be significant considering these stocks make up a significant amount of both the S&P 500 and Nasdaq and have accounted for most of their gains since the start of the year.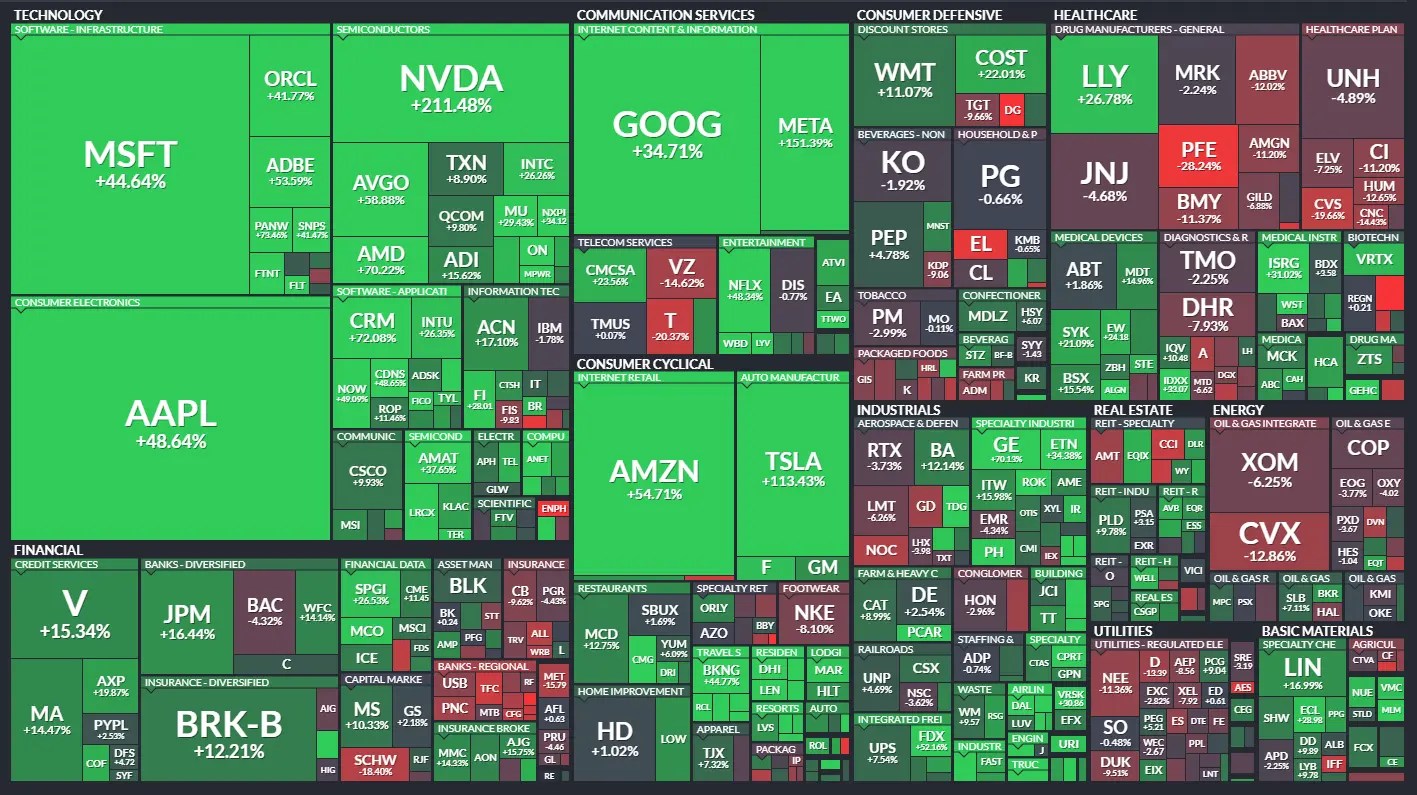 U.S. Stock Market Composition
As such, there will be a lot on the line when the so-called ‘FAAMG’ group of mega-cap companies report their respective results in the days ahead.
Microsoft
*Earnings Date: Tuesday, July 25
*EPS Growth Estimate: +14.3% Y-o-Y
*Revenue Growth Estimate: +7% Y-o-Y
*Year-To-Date Performance: +44.6%
*Market Cap: $2.58 Trillion
Microsoft will be the first ‘FAAMG’ company to report earnings when it delivers its latest quarterly results after U.S. markets close on Tuesday, July 25, at 16:05 ET (20:05 GMT).
The Redmond, Washington-based software-and-hardware giant is forecast to post double-digit profit growth as well as a modest increase in revenue growth, reflecting solid demand for its cloud computing products.
Unsurprisingly, an InvestingPro survey of analyst earnings revisions points to mounting optimism ahead of Microsoft’s report, with analysts raising their EPS estimates 23 times in the last 90 days, compared to three downward revisions.
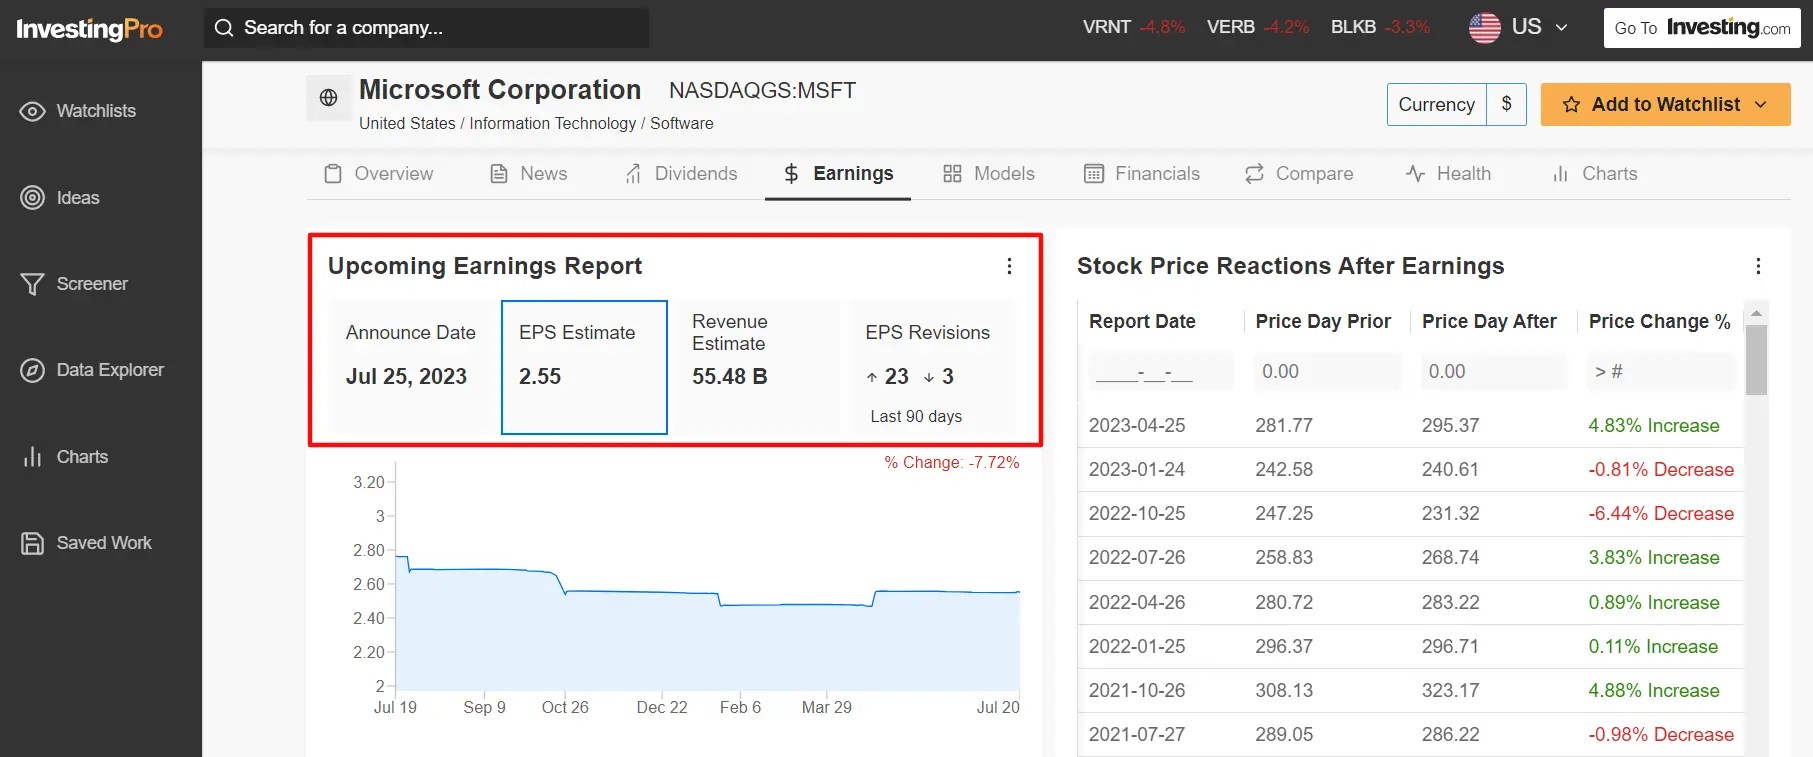 MSFT Earnings DataSource: InvestingPro
Consensus estimates call for earnings per share of $2.55 for its fiscal fourth quarter, improving 14.3% from a profit of $2.23 in the year-ago period amid the positive impact of reduced operating expenses and ongoing job cuts.
Meanwhile, sales are expected to grow 7% annually to $55.48 billion, thanks to a strong performance in its cloud business as well as fresh initiatives in artificial intelligence.
If those figures are confirmed, it would mark the best quarter in Microsoft’s 48-year history, demonstrating the strength and resilience of its operating business as well as strong execution across the company.
Microsoft surpassed expectations on both the top and bottom lines in the last quarter and beat estimates on quarterly revenue guidance as well, sending shares higher by 4.8%.
The Key Metrics
As always, most of the focus will be on the performance of Microsoft’s Intelligent Cloud segment, which includes Azure public cloud services, Windows Server, SQL Server, and Enterprise Services.
The key unit saw sales growth of 16% in fiscal Q3 to $22.08 billion, while revenue from its Azure cloud services, which Microsoft does not report in dollars, grew 27%, compared with 31% in the preceding quarter.
Revenue growth in the Productivity and Business Processes segment, including Office 365 cloud productivity software, Dynamics products and cloud services, LinkedIn, and Teams communications app, will also be of interest after rising nearly 11% to $17.5 billion in the last quarter.
MSFT Stock Performance
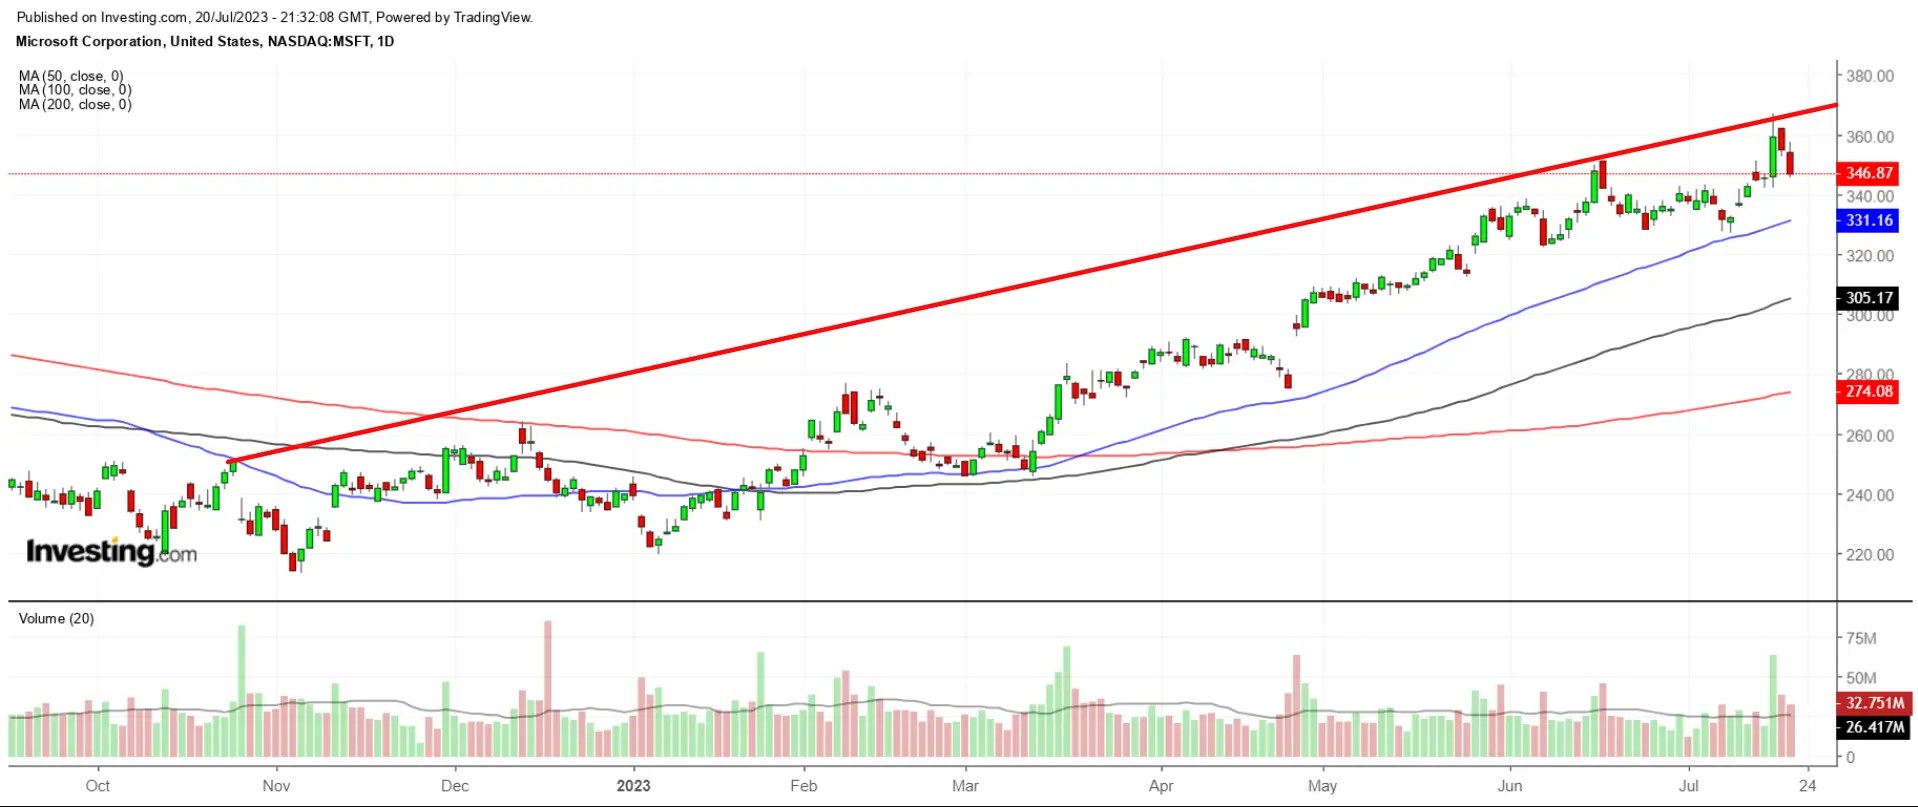 MSFT Daily Chart
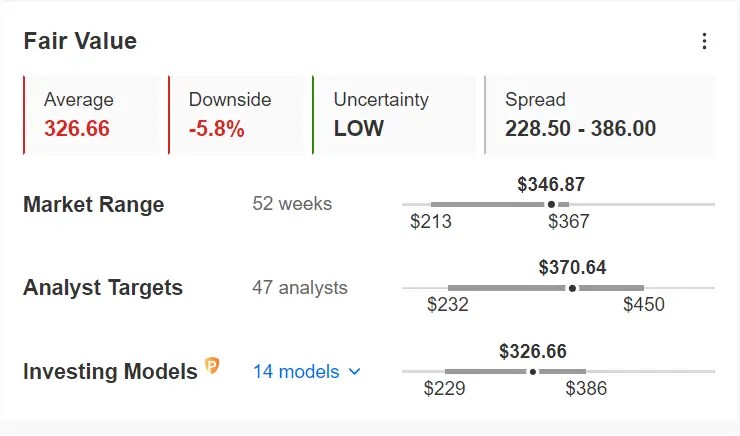
MSFT stock rose to a new all-time high of $366.78 on Wednesday; it ended at $346.87 on Thursday. With a market cap of $2.58 trillion, Microsoft is the world’s second-most valuable company.
Microsoft shares have been on a major uptrend since the start of the year, jumping 44.6% in 2023 as the tech heavyweight benefits from its growing involvement in the emerging AI space. Thanks to its $10 billion investment in ChatGPT-owner OpenAI, Microsoft has become one of the perceived front-runners in the AI chatbot software race.
 MSFT Fair Value
Source: InvestingPro
While Microsoft remains a favorite amongst Wall Street analysts, shares appear to be slightly overvalued heading into next week’s earnings update, as per the quantitative models in InvestingPro, which point to a potential downside of roughly 6% from current levels.
Alphabet
*Earnings Date: Tuesday, July 25
*EPS Growth Estimate: +10.7% Y-o-Y
*Revenue Growth Estimate: +4.2% Y-o-Y
*Year-To-Date Performance: +35.1%
*Market Cap: $1.51 Trillion
Google-parent Alphabet is set to deliver its second-quarter earnings and revenue update after the U.S. market closes on Tuesday, July 25 at 16:15 ET (20:15 GMT) and results are expected to get a boost from a strong performance in its search and cloud-computing businesses.
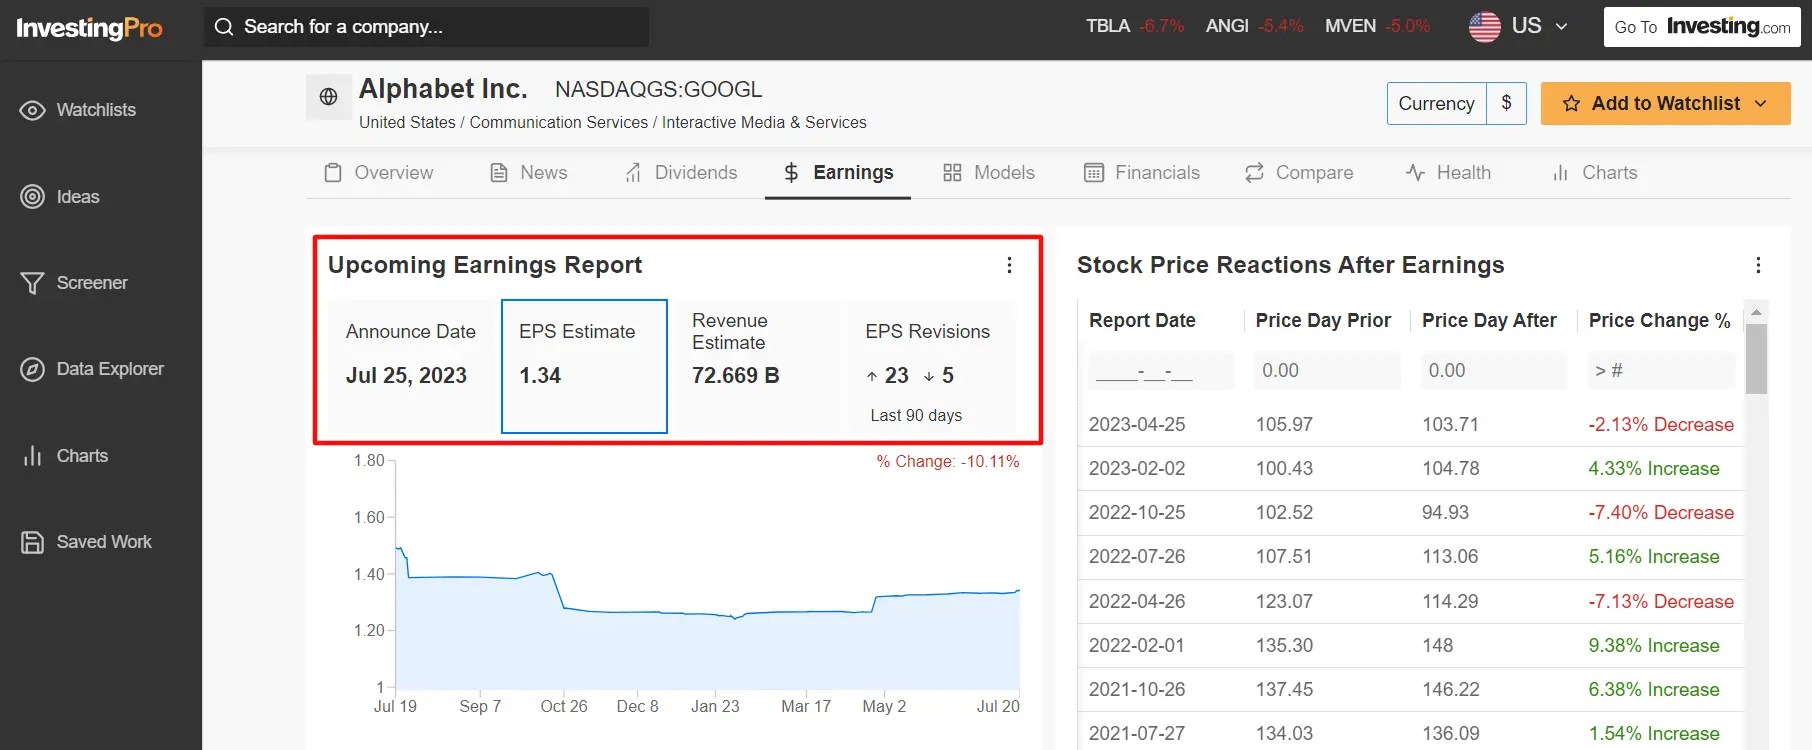
Analysts have become increasingly bullish ahead of the print, according to an InvestingPro survey: of the 28 analysts surveyed, 23 upwardly revised their GOOGL earnings forecast, while only five made downward revisions.
 GOOGL Earnings DataSource: InvestingPro
Consensus estimates call for Alphabet to report Q2 profit of $1.34 per share, rising 10.7% from EPS of $1.21 in the same quarter a year earlier, as the tech giant continues to reap the benefits of ongoing cost-cutting measures.
Revenue is forecast to increase roughly 4% from the year-ago period to $72.66 billion, which if confirmed would mark the third-highest quarterly sales total in the company’s history.
Alphabet reported revenue and earnings for the first quarter that topped estimates, breaking a string of four straight quarters in which the company missed consensus expectations.
The Key Metrics
The market will stay focused on growth rates at Google’s core advertising revenue business, which suffered an annualized drop of 0.2% to $54.5 billion in the previous quarter.
YouTube ad revenue growth will also be eyed after falling significantly short of expectations in the last quarter amid heightened competition from Chinese video-sharing app TikTok.
Meanwhile, one segment that should be primed for a quarter of blockbuster growth is Alphabet’s Google Cloud Platform, which saw sales jump 28% in Q1.
The search giant has been investing heavily in its cloud business as it plays catch up with Amazon Web Services and Microsoft Azure, the top two players in the market.
Perhaps of greater importance, investors will be eager to hear further details on the internet search leader’s AI-based initiatives. The tech behemoth has been under pressure from the growing popularity of ChatGPT, launched late last year by Microsoft-backed OpenAI.
GOOGL Stock Performance
 GOOGL Daily Chart
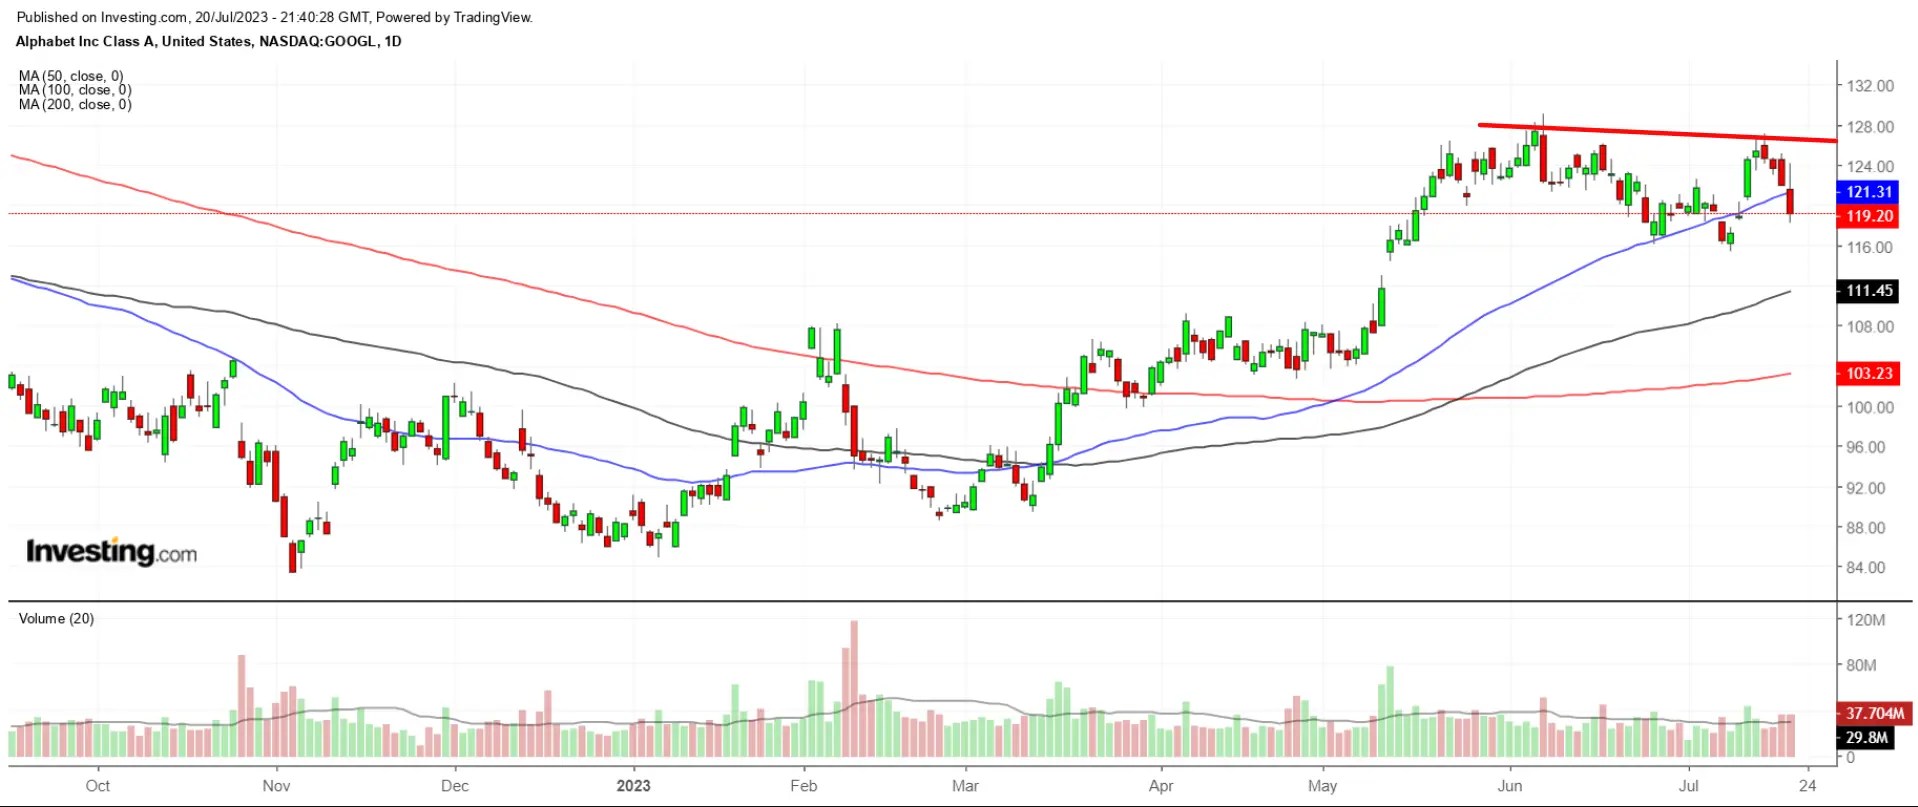
GOOGL stock — which is up 35.1% year-to-date — ended Thursday’s session at $119.20, not far from its 2023 peak of $129.04 reached on April 6.
At current levels, the Mountain View, California-based company has a market cap of $1.51 trillion, making it the third most valuable company trading on the U.S. stock exchange.
 GOOGL Fair Value
Source: InvestingPro
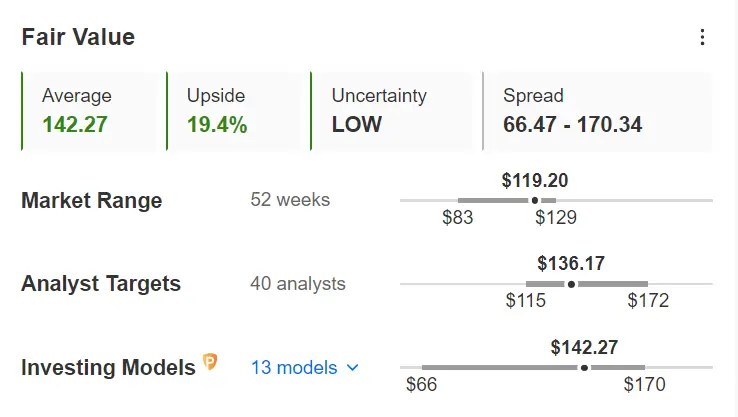
Despite the recent uptrend, 51 out of 54 analysts surveyed by Investing.com rate Alphabet’s stock either as ‘Buy’ or ‘Neutral’, reflecting a bullish recommendation. Likewise, the average fair value price for the shares on InvestingPro stands at $142.27, a potential upside of 19.4% from Thursday’s closing price.
Meta Platforms
*Earnings Date: Wednesday, July 26
*EPS Growth Estimate: +17.1% Y-o-Y
*Revenue Growth Estimate: +7.6% Y-o-Y
*Year-To-Date Performance: +151.3%
*Market Cap: $775.2 Billion
Meta Platforms, parent of social networks Facebook, Instagram, and WhatsApp, is projected to release second-quarter earnings on Wednesday, July 26 after the U.S. market closes at 16:05 ET (20:05 GMT).
An InvestingPro survey of analyst earnings revisions reveals growing optimism ahead of the report, with analysts boosting their EPS estimates 20 times over the last 90 days, while making just two downward revisions.
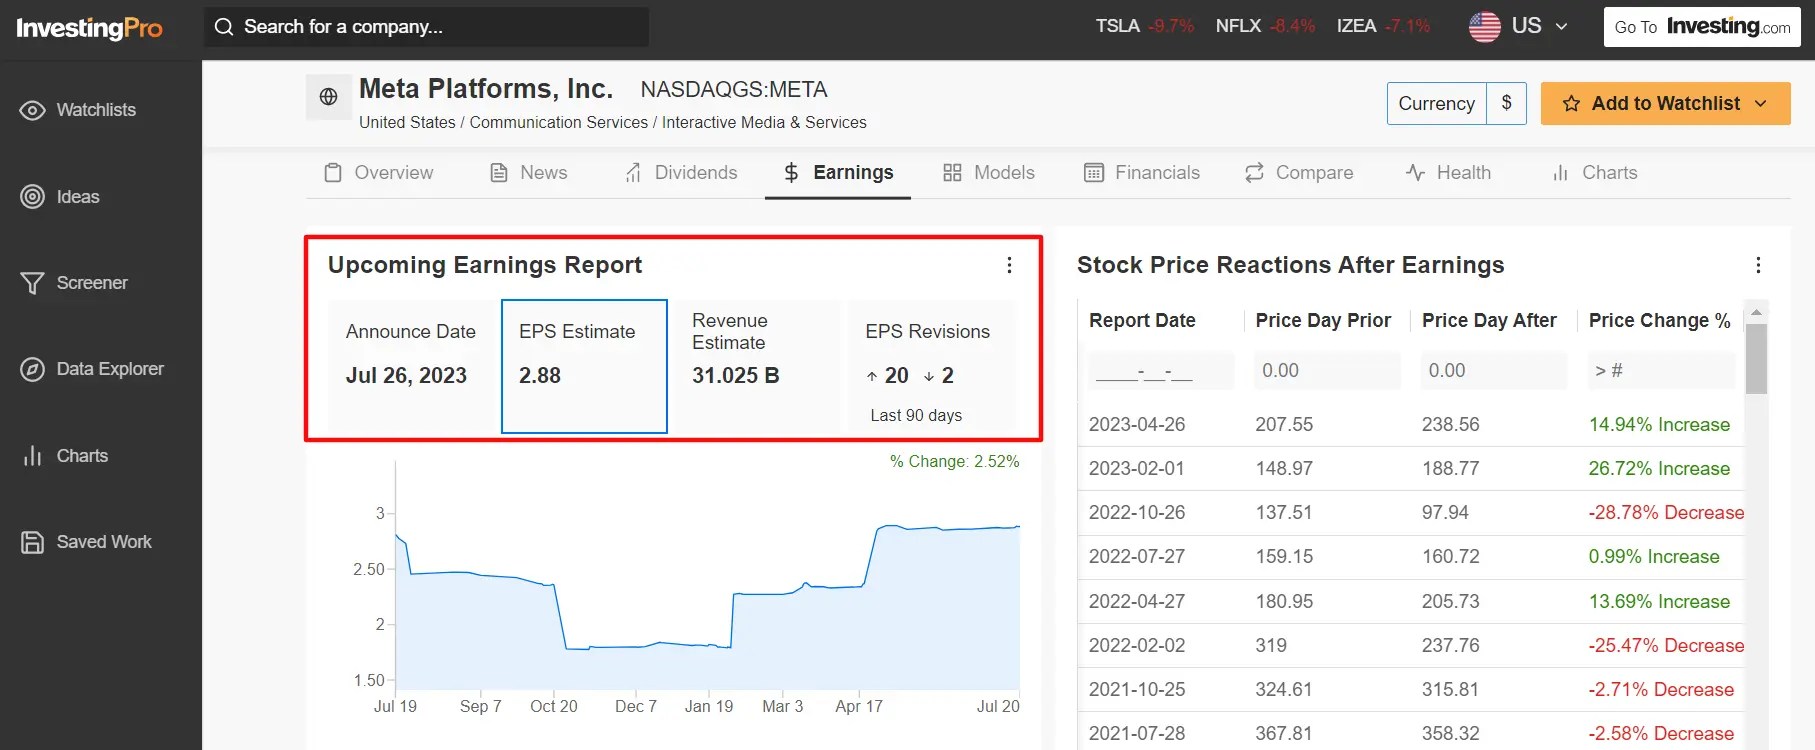 META Earnings DataSource: InvestingPro
Wall Street sees Meta earning a profit of $2.88 per share, climbing 17.1% from EPS of $2.46 in the year-ago period, as the Mark Zuckerberg-led company continues to focus on improving operating efficiency.
Revenue is expected to increase 7.6% year-over-year to $31 billion, amid signs of better conditions in the digital advertising market.
Meta reported an unexpected increase in revenue for the first quarter after three straight periods of declines, sparking a 15% rally in its shares.
The Key Metrics
As usual, investors will pay close attention to Meta’s update regarding Facebook’s daily and monthly active user accounts – two important metrics for the social media giant. Facebook said daily active users (DAUs) rose 4% annually in the previous quarter to 2.04 billion, while monthly active users (MAUs) increased 2% to 2.99 billion.
In addition, Meta’s Reality Labs division, which is responsible for developing virtual reality and augmented reality technologies for the metaverse, will be in focus. The unit logged an operating loss of $3.99 billion in the prior quarter.
META Stock Performance
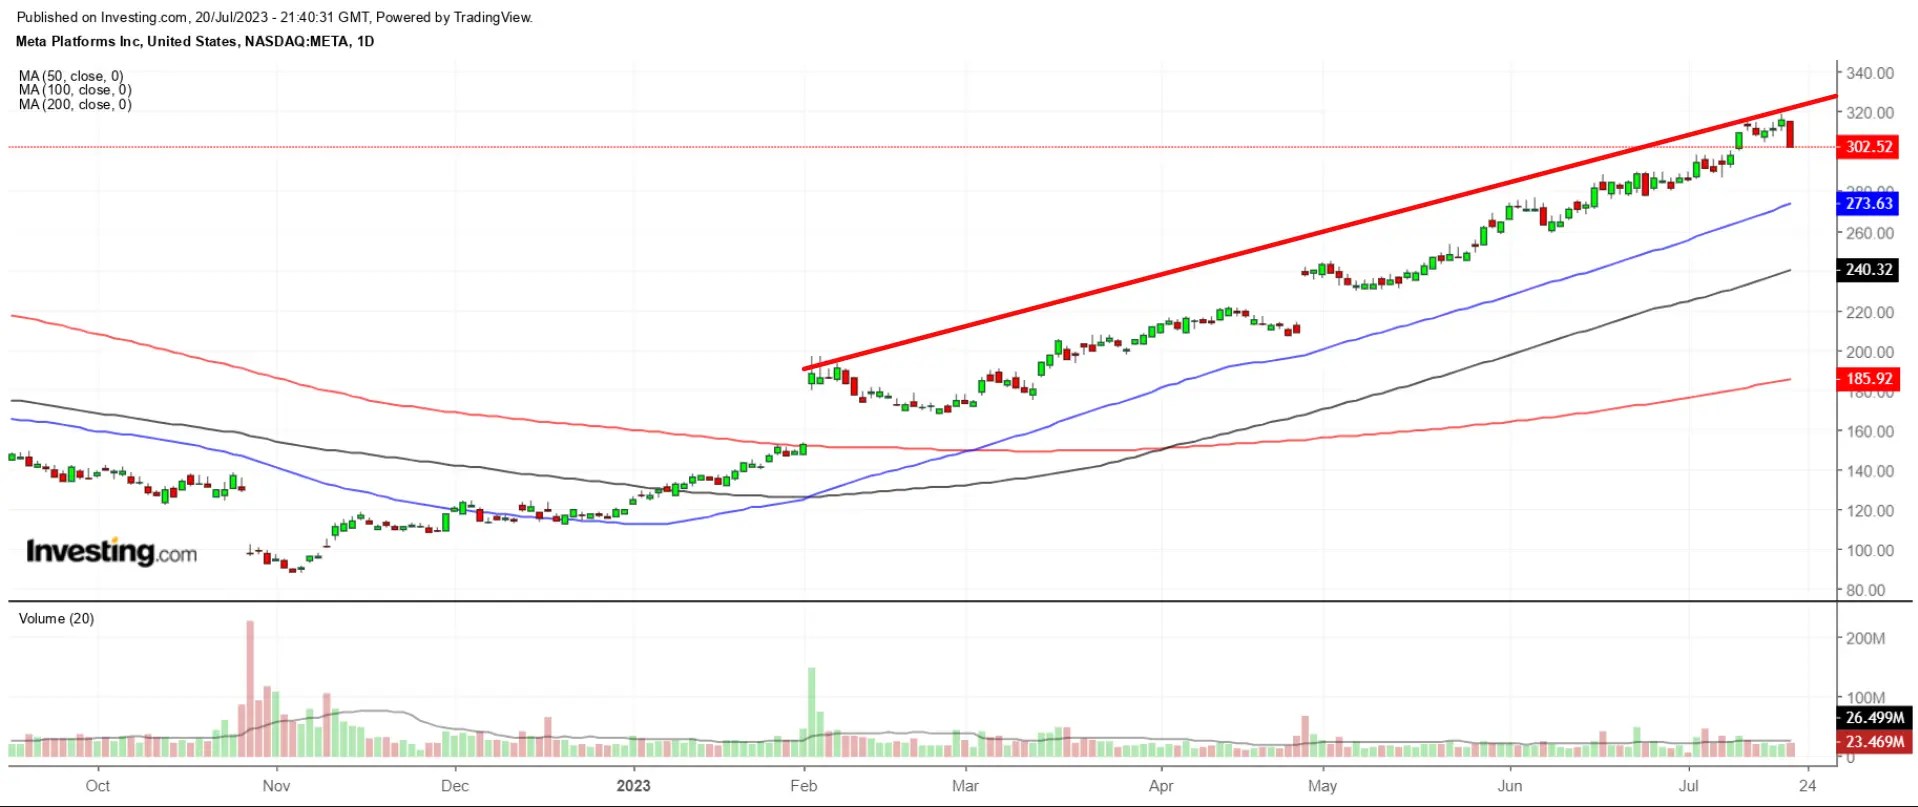 META Daily Chart
Meta’s stock has been on a tear heading into its earnings report, with shares of the Menlo Park, California-based tech company hitting a series of 52-week highs in recent sessions.
META stock closed at $302.52 yesterday, ending just below a 15-month peak. At current levels, Meta has a market cap of $775.2 billion.
Shares have staged an astonishing rally this year and are up a whopping 151%, making META the best-performing ‘FAAMG’ stock of 2023 by a wide margin. Investors have been encouraged by aggressive cost-cutting initiatives implemented by CEO Mark Zuckerberg in recent months.
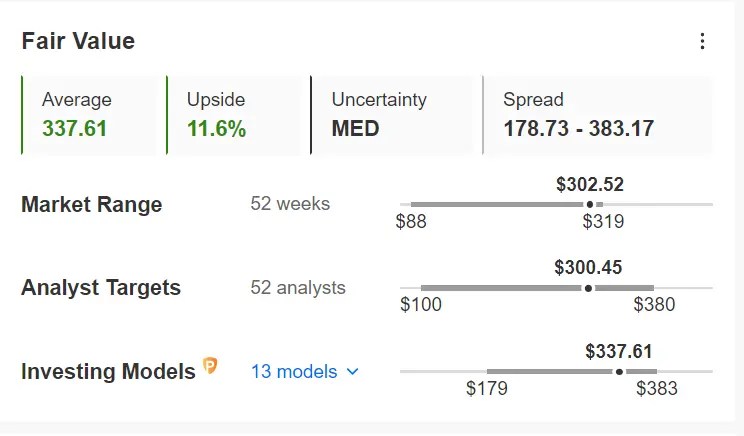 META Fair Value
Source: InvestingPro
It should be noted that even after the stock more than doubled since the start of the year, META shares remain undervalued at the moment according to InvestingPro models, and could see an increase of 11.6% from the current market value.
Amazon
*Earnings Date: Thursday, July 27
*EPS Growth Estimate: +270% Y-o-Y
*Revenue Growth Estimate: +8.3% Y-o-Y
*Year-To-Date Performance: +54.7%
*Market Cap: $1.33 Trillion
Amazon is slated to release its second quarter financial results on Thursday, August 3 at 16:00 ET (20:00 GMT) and sell-side confidence is brimming.
Earnings estimates have been revised upward 19 times in the 90 days leading up to the print, according to an InvestingPro survey, compared to just six downward revisions, as Wall Street grows increasingly bullish on the tech titan.
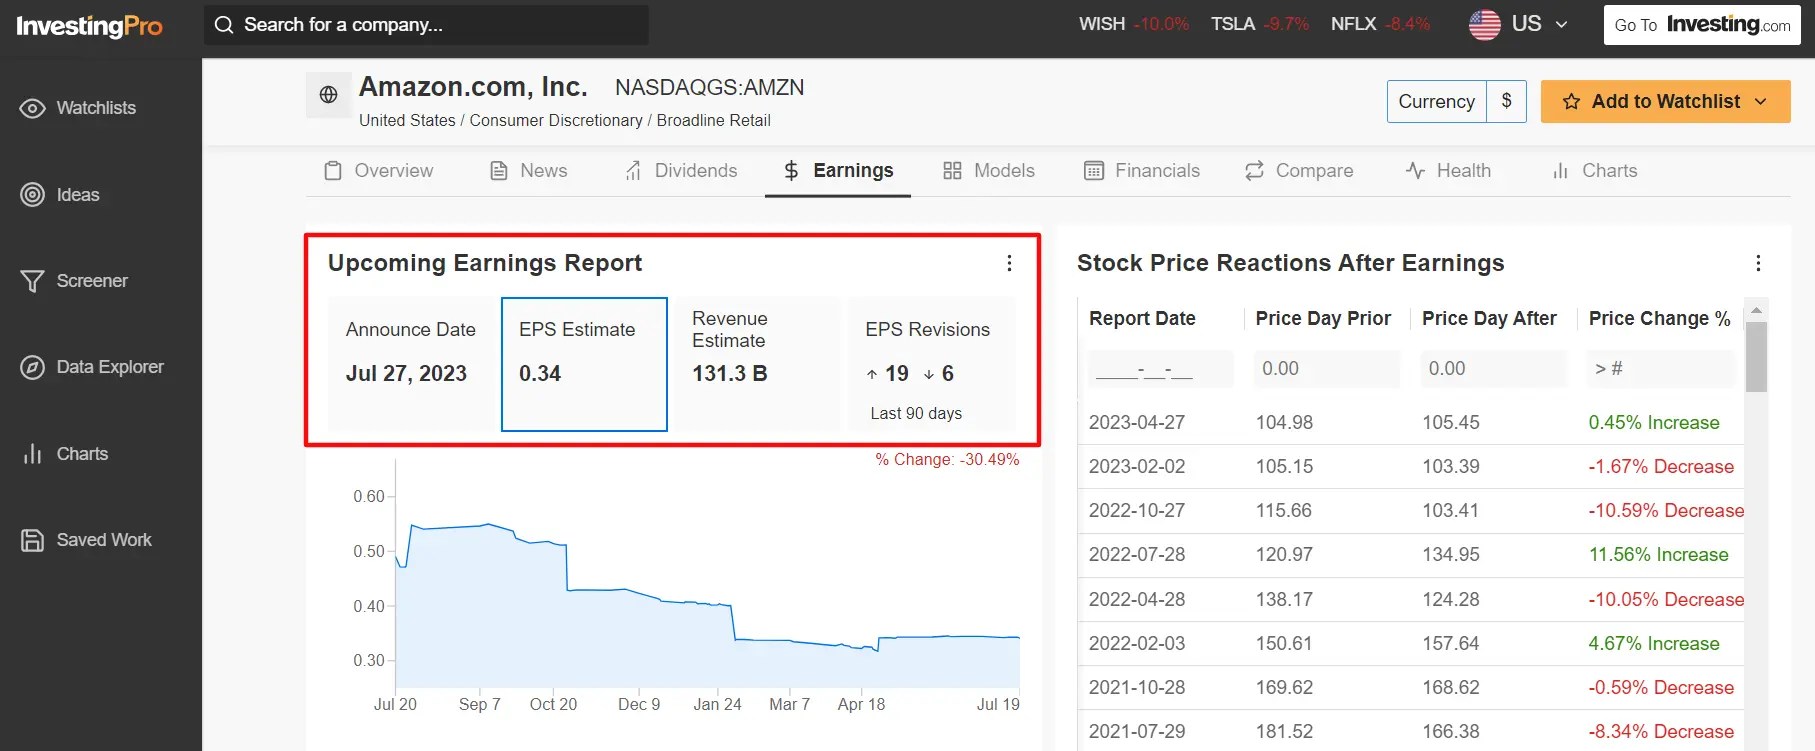 AMZN Earnings DataSource: InvestingPro
Consensus calls for Amazon to post earnings per share of $0.34, compared to a rare loss of $0.20 per share in Q2 2022, thanks to the positive impact of several cost-saving measures implemented in recent months.
Revenue is expected to increase 8.3% from the year-ago period to $131.3 billion, reflecting ongoing strength in its cloud computing and advertising businesses.
The e-commerce and cloud giant reported profit and sales that easily topped Wall Street estimates in the first quarter, despite facing an uncertain demand outlook.
The Key Metrics
Investors will stay laser-focused on Amazon’s cloud unit to see if it can maintain its pace of growth. Amazon Web Services revenue rose about 16% in Q1 to $21.35 billion, slowing from sales growth of 20% in the preceding quarter. Amazon’s AWS is widely considered as the leader in the cloud-computing space, ahead of Microsoft Azure and Google Cloud.
Advertising revenue, which has increasingly become another major growth driver for Amazon, will also be eyed after scoring annualized sales growth of 23% in the last quarter, outpacing online ad companies like Google, Facebook, and Snap (NYSE:SNAP).
AMZN Stock Performance
 AMZN Daily Chart
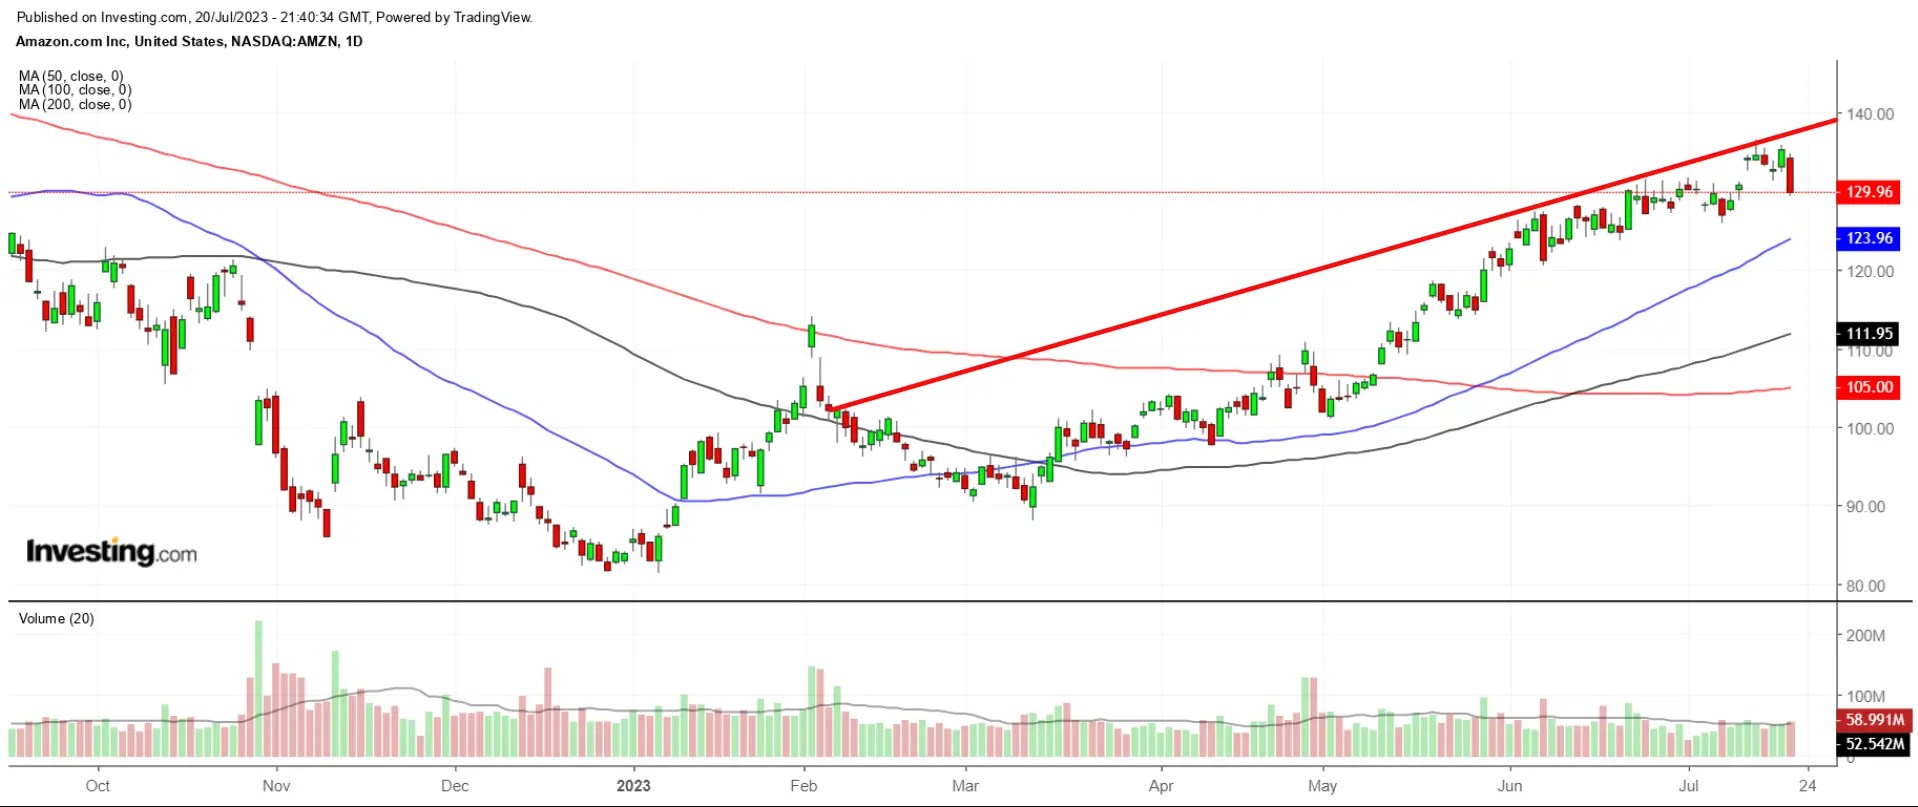
AMZN stock, which rose to its highest level since August 2022 at the start of the week, closed at $129.96 last night. With a valuation of $1.33 trillion, the Seattle, Washington-based tech giant is the fourth most valuable company listed on the U.S. stock exchange.
Shares have significantly outperformed the broader market thus far in 2023, climbing 54.7% year-to-date following last year’s brutal selloff.
 AMZN Fair Value
Source: InvestingPro
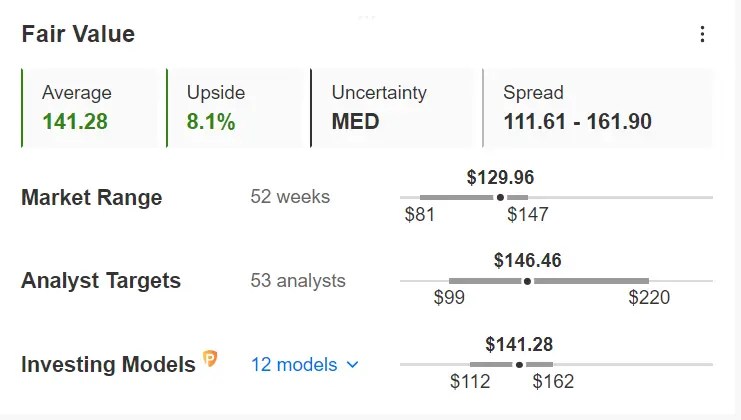
According to the InvestingPro model, Amazon’s stock is still relatively undervalued and could see a gain of 8.1% from current levels, bringing it closer to its fair value of $141.28 per share.
Additionally, more than three-quarters of analysts surveyed by Investing.com rate AMZN at the equivalent of a ‘Buy’ rating, with an average price target of around $146, implying upside of 12.7% from recent trading levels.
Apple
*Earnings Date: Thursday, August 3
*EPS Growth Estimate: -0.8% Y-o-Y
*Revenue Growth Estimate: -1.4% Y-o-Y
*Year-To-Date Performance: +48.6%
*Market Cap: $3.04 Trillion
Apple will be the final ‘FAAMG’ stock to report quarterly results when it delivers fiscal third-quarter earnings after the market closes at 16:30 ET (20:30 GMT) on Thursday, August 3. A call with CEO Tim Cook and CFO Luca Maestri is set for 17:00 ET.
The Cupertino, California-based consumer electronics giant is forecast to suffer a rare profit decline and its slowest revenue growth in several years amid the challenging operating environment that has weighed on demand for its pricey smartphone models.
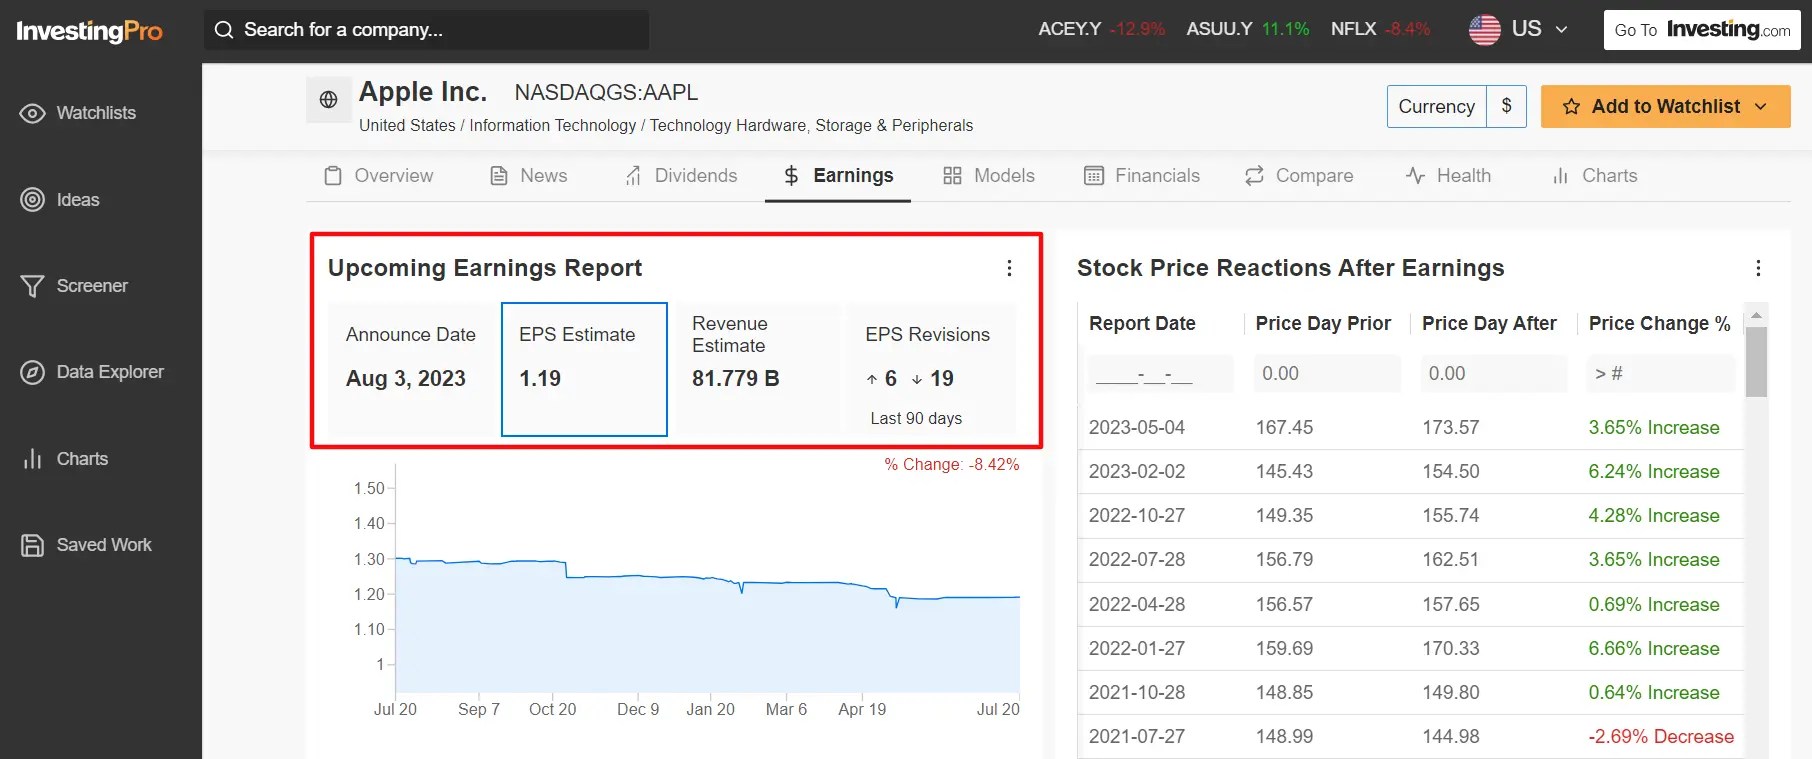
Not surprisingly, profit forecasts have been revised downward 19 times in the past 90 days, according to InvestingPro, as the iPhone maker deals with several headwinds.
 AAPL Earnings DataSource: InvestingPro
As per Investing.com consensus estimates, Apple’s earnings per share are expected to be $1.19, a decline of 0.8% from EPS of $1.20 a year ago. Revenue is forecast at $81.77 billion, or a 1.4% decrease annually amid slowing demand for its high-end smartphones and computers.
If that is, in fact, the reality, it would mark the conglomerate’s third consecutive quarter of declining sales amid the gloomy macroeconomic outlook.
The Key Metrics
Wall Street will pay close attention to growth in Apple’s iPhone business after sales rose just 2% during the previous quarter.
Apple’s Mac and iPad businesses will also be of interest amid a deteriorating PC market. Apple’s Mac sales shrank more than 31% y-o-y in the last quarter, while revenue from iPads declined nearly 13% annually.
One bright spot is expected to be the company’s Services business, which was the fastest growing segment in fiscal Q2 with annualized revenue growth of 5.5%. The unit includes sales from Apple’s App Store, monthly subscriptions, payment fees, extended warranties, licensing fees, and search-licensing revenue.
AAPL Stock Performance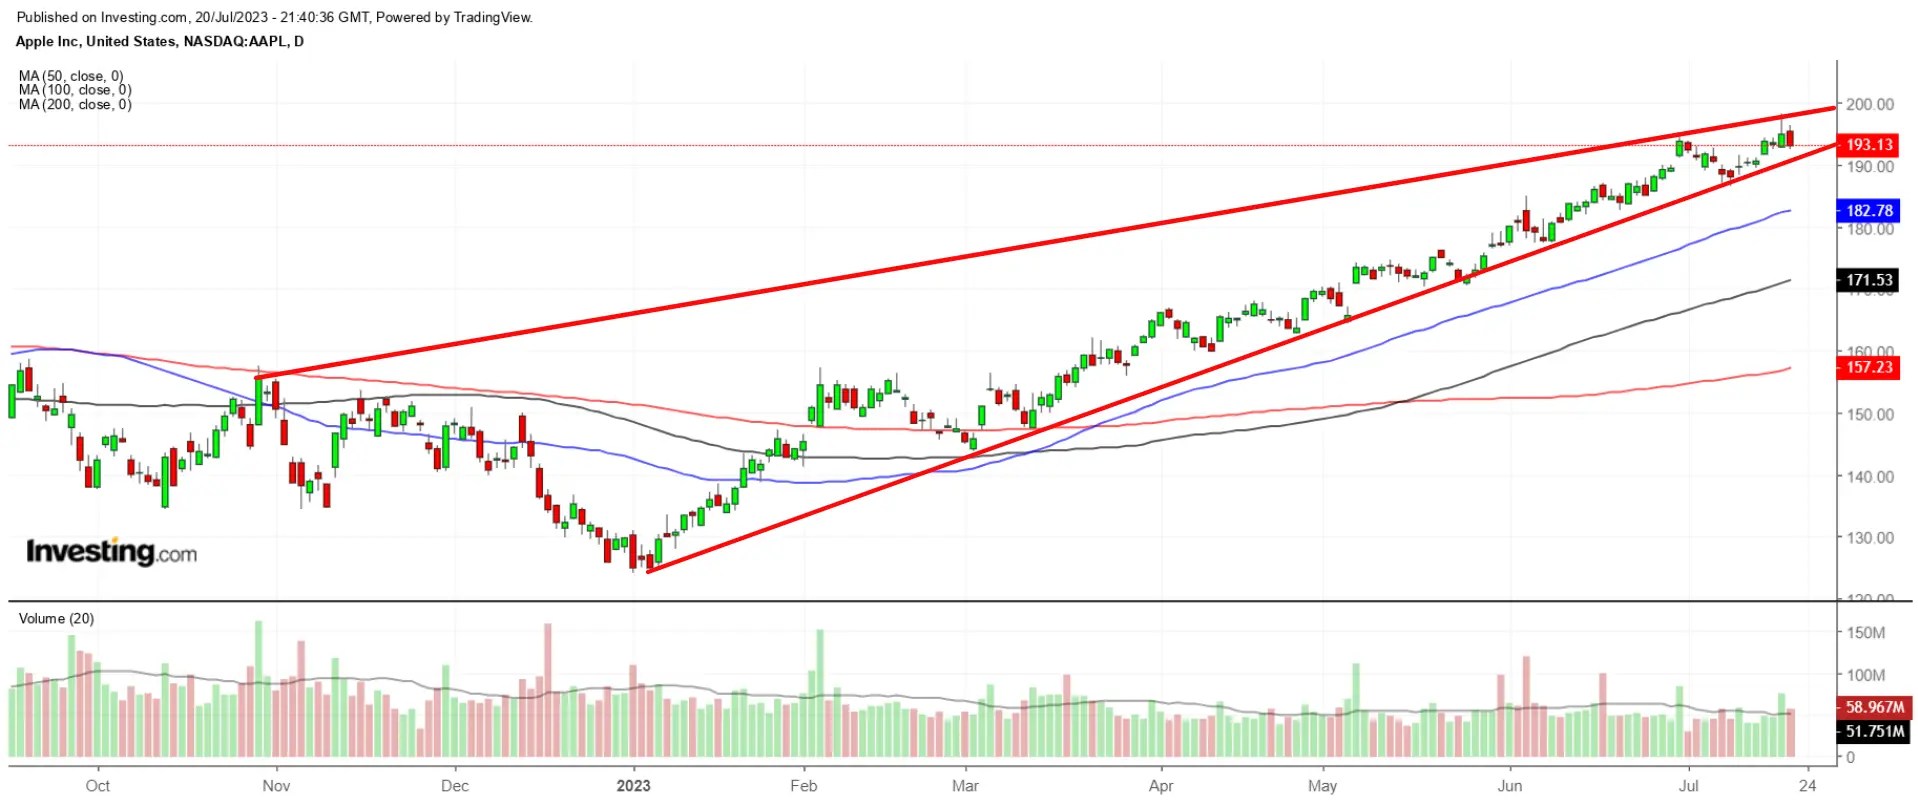 AAPL Daily Chart
AAPL stock — which has surged 48.6% year-to-date — closed at $193.13 on Thursday, just below the previous session’s all-time peak of $198.19.
At current levels, the consumer electronics conglomerate has a market cap of $3.04 trillion, making it the most valuable company trading on the U.S. stock exchange.
 AAPL Fair Value
Source: InvestingPro
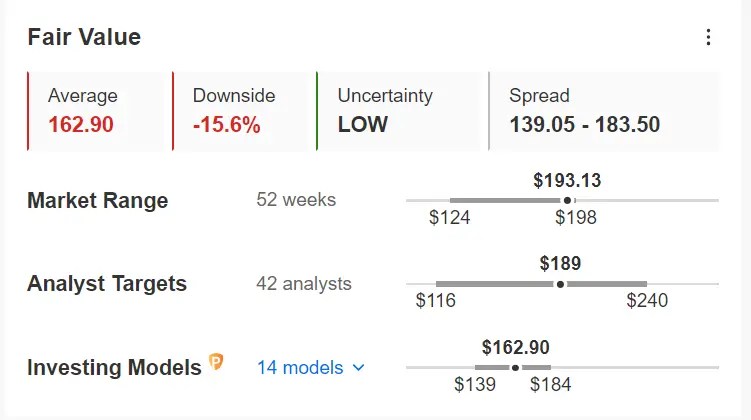
Apple’s stock appears to be overvalued heading into the earnings print according to a number of valuation models on InvestingPro: the average Fair Value for AAPL stands at $162.90, a potential downside of 15.6% from current levels. Get the Full Picture Here
***
Disclosure: At the time of writing, I am long on the S&P 500, and the Nasdaq 100 via the SPDR S&P 500 ETF (SPY), and the Invesco QQQ Trust ETF (QQQ). I am also long on the Technology Select Sector SPDR ETF (XLK). I regularly rebalance my portfolio of individual stocks and ETFs based on ongoing risk assessment of both the macroeconomic environment and companies’ financials.
The views discussed in this article are solely the opinion of the author and should not be taken as investment advice.
Source: Investing.com


