US500
-0.50%
Add to/Remove from Watchlist
Add to Watchlist
Add Position
Position added successfully to:
Please name your holdings portfolio
Type:
BUY
SELL
Date:
Amount:
Price
Point Value:
Leverage:
1:1
1:10
1:25
1:50
1:100
1:200
1:400
1:500
1:1000
Commission:
Create New Watchlist
Create
Create a new holdings portfolio
Add
Create
+ Add another position
Close
US2000
-1.01%
Add to/Remove from Watchlist
Add to Watchlist
Add Position
Position added successfully to:
Please name your holdings portfolio
Type:
BUY
SELL
Date:
Amount:
Price
Point Value:
Leverage:
1:1
1:10
1:25
1:50
1:100
1:200
1:400
1:500
1:1000
Commission:
Create New Watchlist
Create
Create a new holdings portfolio
Add
Create
+ Add another position
Close
IWM
-0.83%
Add to/Remove from Watchlist
Add to Watchlist
Add Position
Position added successfully to:
Please name your holdings portfolio
Type:
BUY
SELL
Date:
Amount:
Price
Point Value:
Leverage:
1:1
1:10
1:25
1:50
1:100
1:200
1:400
1:500
1:1000
Commission:
Create New Watchlist
Create
Create a new holdings portfolio
Add
Create
+ Add another position
Close
IXIC
-1.23%
Add to/Remove from Watchlist
Add to Watchlist
Add Position
Position added successfully to:
Please name your holdings portfolio
Type:
BUY
SELL
Date:
Amount:
Price
Point Value:
Leverage:
1:1
1:10
1:25
1:50
1:100
1:200
1:400
1:500
1:1000
Commission:
Create New Watchlist
Create
Create a new holdings portfolio
Add
Create
+ Add another position
Close
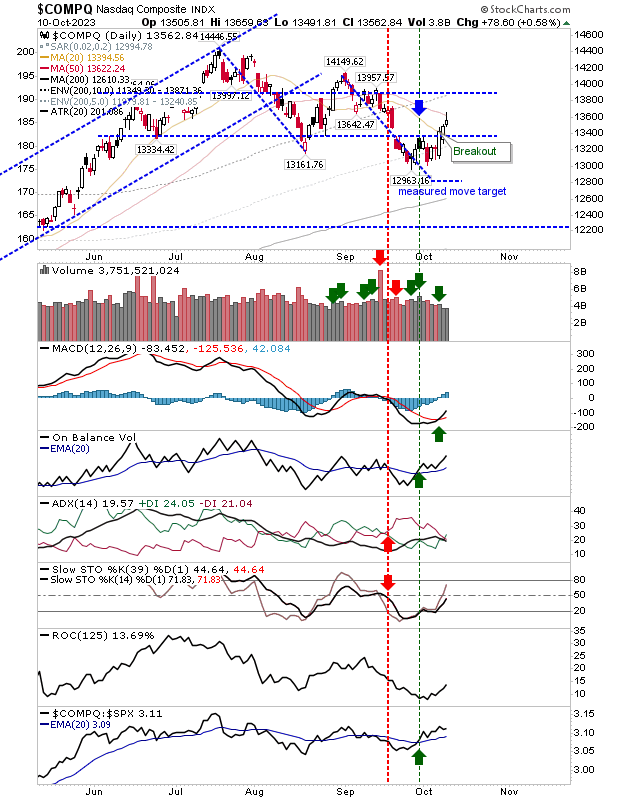
It’s early days, but indexes are working towards swing lows to help start rallies off last week’s lows. The Nasdaq took out the swing high from last week and its 20-day MA, but was repelled from its 50-day MA with today’s spike high.
The buying came with MACD trigger, ADX, and On-Balance-Volume ‘buy’ triggers. If the buying continues, then a stochastic ‘buy’ will complete the net bullish technical picture over the coming days.
 COMPQ-Daily Chart
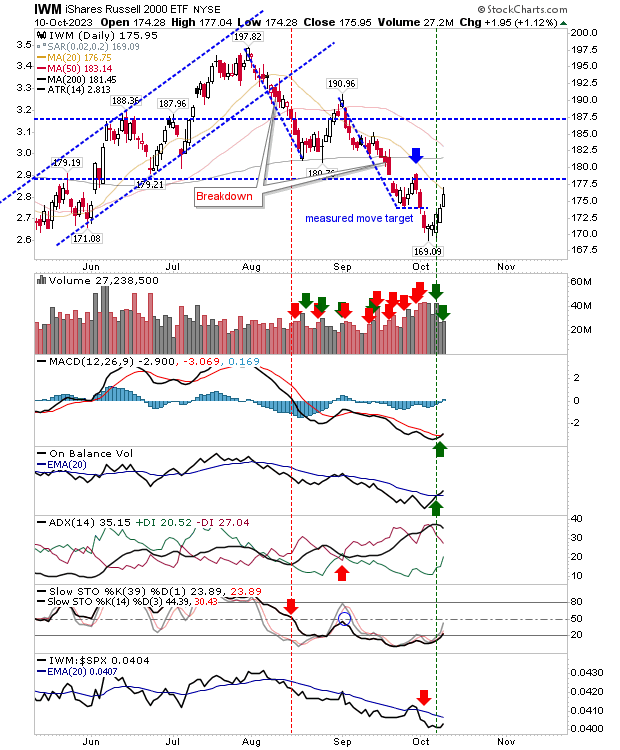
The Russell 2000 (IWM) wasn’t left out, although it hasn’t done enough to challenge its downtrend. It managed to tag its 20-day MA with ‘buy’ triggers in the MACD and On-Balance-Volume, but it needs to take out the last swing high before it can be considered a challenge on its trend decline.
 IWM-Daily Chart
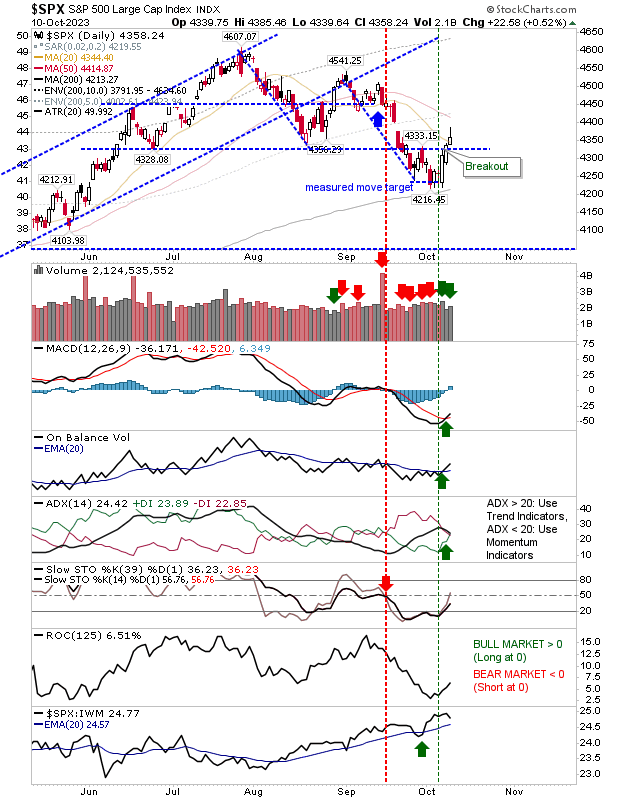
The S&P 500 sits in a similar position to the Nasdaq, having taken out the last swing high on ‘buy’ triggers in ADX, On-Balance-Volume, and MACD. Intermediate-term stochastics are further away from a bullish cross than they are in the Nasdaq, so they will likely lag the latter index.
 SPX-Daily Chart
Yesterday’s spike highs suggest near-term peaks may have been reached after a sequence of bullish days across indexes. Ideally, we will want to see the past swing high peaks hold as support, even allowing room for intraday violations, but not have any undercuts on heavy bearish candlesticks.
Source: Investing.com


