US500
-1.26%
Add to/Remove from Watchlist
Add to Watchlist
Add Position
Position added successfully to:
Please name your holdings portfolio
Type:
BUY
SELL
Date:
Amount:
Price
Point Value:
Leverage:
1:1
1:10
1:25
1:50
1:100
1:200
1:400
1:500
1:1000
Commission:
Create New Watchlist
Create
Create a new holdings portfolio
Add
Create
+ Add another position
Close
US2000
-1.29%
Add to/Remove from Watchlist
Add to Watchlist
Add Position
Position added successfully to:
Please name your holdings portfolio
Type:
BUY
SELL
Date:
Amount:
Price
Point Value:
Leverage:
1:1
1:10
1:25
1:50
1:100
1:200
1:400
1:500
1:1000
Commission:
Create New Watchlist
Create
Create a new holdings portfolio
Add
Create
+ Add another position
Close
IWM
-1.29%
Add to/Remove from Watchlist
Add to Watchlist
Add Position
Position added successfully to:
Please name your holdings portfolio
Type:
BUY
SELL
Date:
Amount:
Price
Point Value:
Leverage:
1:1
1:10
1:25
1:50
1:100
1:200
1:400
1:500
1:1000
Commission:
Create New Watchlist
Create
Create a new holdings portfolio
Add
Create
+ Add another position
Close
IXIC
-1.53%
Add to/Remove from Watchlist
Add to Watchlist
Add Position
Position added successfully to:
Please name your holdings portfolio
Type:
BUY
SELL
Date:
Amount:
Price
Point Value:
Leverage:
1:1
1:10
1:25
1:50
1:100
1:200
1:400
1:500
1:1000
Commission:
Create New Watchlist
Create
Create a new holdings portfolio
Add
Create
+ Add another position
Close
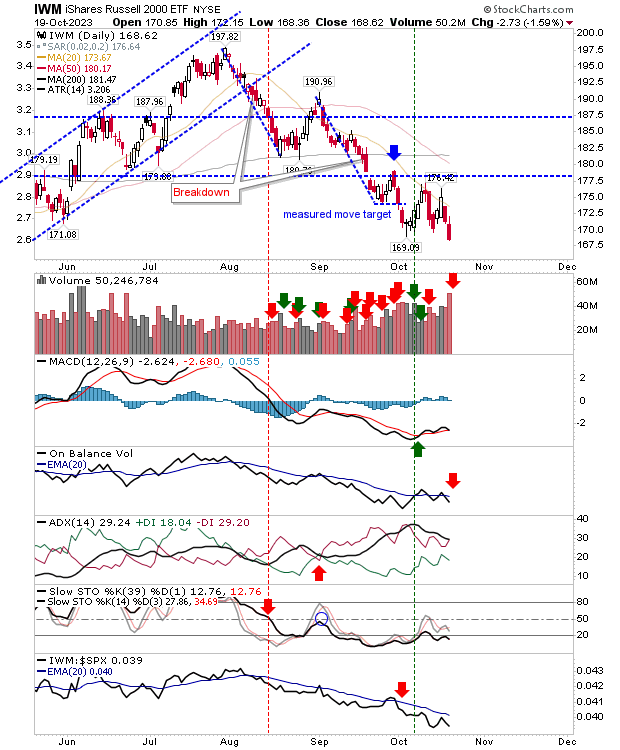
A triple whammy for indexes and one where bears took all the plaudits. The Russell 2000 (IWM) experienced an ugly distribution day that drove through the prior spike low. We now have a crash opportunity that could spill into the weekly time frame.
I should add, we are only 7% below the 200-day MA and Russell 2000 losses generated by crashes typically touch into a 15% loss or more against the 200-day MA.
However, we are in the accumulate mode, so if you are an investor, then buying Small Cap stocks should see the reward in the coming years; if we get down to a 20% loss against the 200-day MA, then back up the truck.
 IWM-Daily Chart
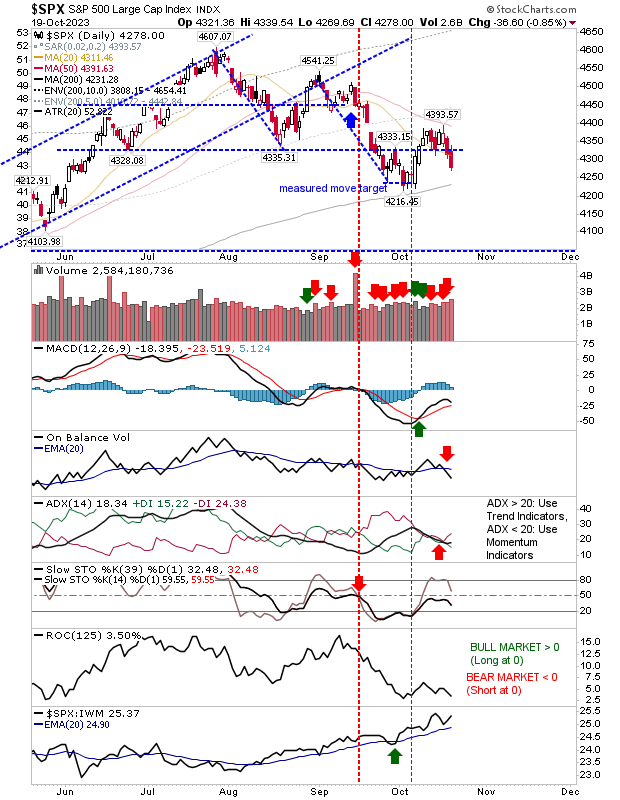
The Nasdaq and S&P 500 are still *above* their 200-day MAs, so we don’t have a crash watch here, but what we do have is a loss of daily support that opens up for tests of weekly support.
Volume climbed to register as distribution for the S&P 500, but not the Nasdaq. The first of these indexes to get to their 200-day MAs will be the S&P 500.
 SPX-Daily Chart
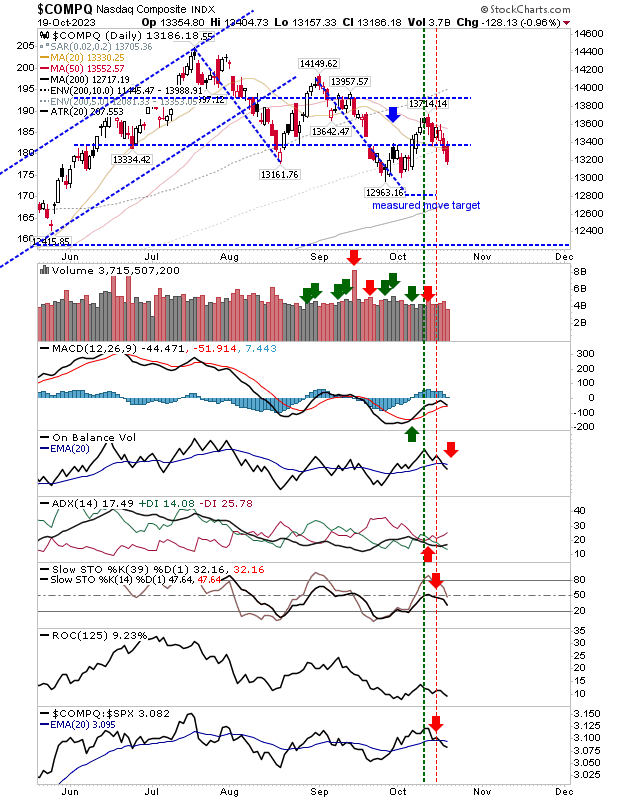
The Nasdaq took the smallest loss on the day. The index was rebuffed by its 50-day MA in early October and has struggled to get above this moving average since the undercut in August.
The supporting MACD is on the verge of a new ‘sell’ trigger below the bullish mid-line (aka a “strong sell” signal). And given momentum (custom stochastics) is not oversold, but also, not above the bullish mid-line, means more downside is likely.
 COMPQ-Daily Chart
I would be looking for a loss today to pressure the weekly time frame. There won’t be much positive news to lean on (as if there ever was when markets fall), but the Russell 2000 is close to a capitulation, and buying into this weakness will generate gains in the long run.
The S&P 500 and Nasdaq are lagging in their declines, but are likely to recover before things truly get ugly for these indexes.
Source: Investing.com


