XAU/USD
+0.63%
Add to/Remove from Watchlist
Add to Watchlist
Add Position
Position added successfully to:
Please name your holdings portfolio
Type:
BUY
SELL
Date:
Amount:
Price
Point Value:
Leverage:
1:1
1:10
1:25
1:50
1:100
1:200
1:400
1:500
1:1000
Commission:
Create New Watchlist
Create
Create a new holdings portfolio
Add
Create
+ Add another position
Close
Gold
+0.52%
Add to/Remove from Watchlist
Add to Watchlist
Add Position
Position added successfully to:
Please name your holdings portfolio
Type:
BUY
SELL
Date:
Amount:
Price
Point Value:
Leverage:
1:1
1:10
1:25
1:50
1:100
1:200
1:400
1:500
1:1000
Commission:
Create New Watchlist
Create
Create a new holdings portfolio
Add
Create
+ Add another position
Close
DXY
-0.16%
Add to/Remove from Watchlist
Add to Watchlist
Add Position
Position added successfully to:
Please name your holdings portfolio
Type:
BUY
SELL
Date:
Amount:
Price
Point Value:
Leverage:
1:1
1:10
1:25
1:50
1:100
1:200
1:400
1:500
1:1000
Commission:
Create New Watchlist
Create
Create a new holdings portfolio
Add
Create
+ Add another position
Close
U.S. inflation has fallen faster than expected and Fed’s target is right around the corner
Meanwhile, gold has rebounded after US dollar’s weakening
But $2,000 remains a key resistance for the yellow metal
Secure your Black Friday gains with InvestingPro’s up to 55% discount!
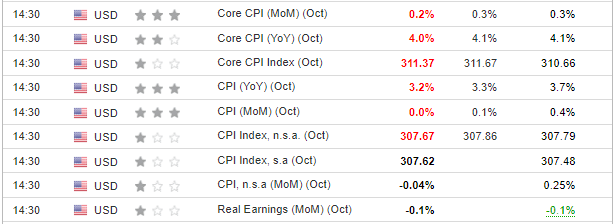
On Tuesday, inflation data came in only slightly below consensus, garnering a strong response from the financial markets. This not only translated into robust gains in the stock markets but also triggered a depreciation of the U.S. dollar and a decline in Treasury bond yields.
The ripple effect was also felt in gold, which remained within the $1,900-$2,000 per ounce range. Beyond macroeconomic influences, the gold bulls found support from Central Banks, with demand notably up by 14% year-on-year, reaching 800 tons in Q3.
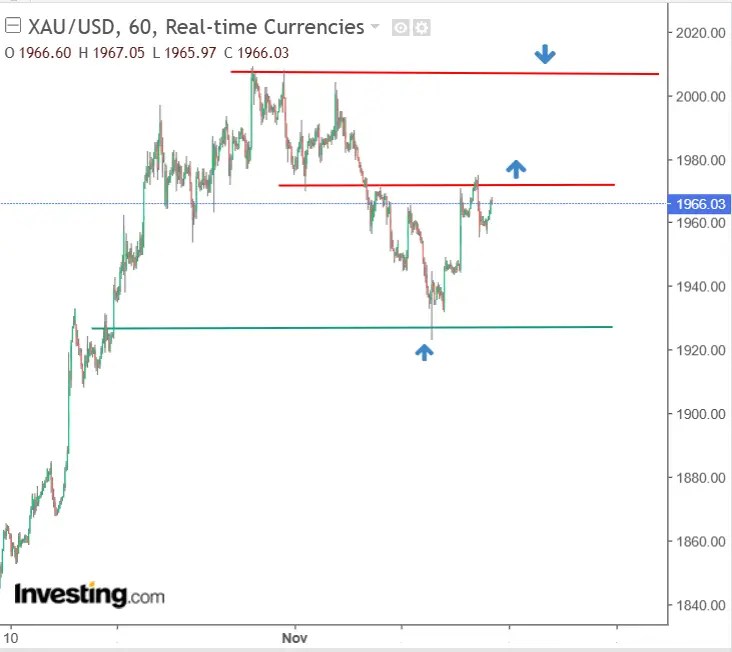
From a technical analysis standpoint, the focal point of resistance continues to hover around the $2,000 mark.
Why Did the Market React So Strongly to the Inflation Data?
Analyzing this year’s Consumer Price Index (CPI) data, a consistent trend emerged from March to July, with readings consistently surpassing forecasts by 0.1%, except for March, which saw a 0.2% exception.
Tuesday’s data followed suit, with CPI at 3.2%, slightly edging below the market consensus of 3.3%. Core CPI also performed well, registering at 4%, better than the forecasted 4.1%.
 US Inflation
Source: Investing.com
Unlike the March-July period, the market’s reaction to the data was intense with effects spilling over to the U.S. dollar, stock indexes, bond yields, and commodities. This moment stands out as the Federal Reserve finds itself on the precipice of a critical decision.
It not only needs to determine the conclusion of the hike cycle but also must signal the possibility of a long-anticipated pivot.
The prevailing market consensus points towards the initiation of monetary easing in May of the upcoming year, and any improvement in inflation data could expedite this anticipated shift.
Gold Bulls Eye Dovish Tone From Fed
The gold market is keeping a keen eye on dovish signals. In a recent analysis, I indicated that a true bull market in gold might still be on hold.
Despite events in Gaza and favorable inflation data, the price hasn’t consistently breached the $2,000 per ounce mark, reinforcing the notion that a Fed pivot could be the catalyst for the next bull market.
Taking a longer-term perspective on gold prices, a significant factor in play is the mounting debt of Western economies, spearheaded by the U.S. The current U.S. government debt has already surpassed $33.7 trillion and is projected to increase by another trillion in the near future.
With major foreign buyers showing declining interest, Moody’s is sounding the alarm on potential fiscal challenges, a situation that undoubtedly favors gold.
Technical View: Gold Defends Support Level
At the beginning of the week, gold prices defended a local demand zone located in the price region of $1930 per ounce, which means that the recent uptrend has held within a long-term consolidation.
 Gold Price Chart
The critical resistance zone lies at the already-tested level of $1970 per ounce. A potential breakthrough here could pave the way for another attempt to breach the psychological barrier of $2,000, a task that may pose challenges in the short term considering the aforementioned factors.
In the event that bulls fail to secure this breakthrough, the likely scenario would involve the continuation of a sideways trend within the range of $1970-$1930.
***
Buy or Sell? Get the answer with InvestingPro for Half of the Price This Black Friday!
Timely insights and informed decisions are the keys to maximizing profit potential. This Black Friday, make the smartest investment decision in the market and save up to 55% on InvestingPro subscription plans.
Whether you’re a seasoned trader or just starting your investment journey, this offer is designed to equip you with the wisdom needed for more intelligent and profitable trading.
Black Friday Sale – Claim Your Discount Now!
Disclaimer: This article is written for informational purposes only; it does not constitute a solicitation, offer, advice, counsel or recommendation to invest as such it is not intended to incentivize the purchase of assets in any way. I would like to remind you that any type of asset, is evaluated from multiple points of view and is highly risky and therefore, any investment decision and the associated risk remains with the investor.
Source: Investing.com


