US500
+0.80%
Add to/Remove from Watchlist
Add to Watchlist
Add Position
Position added successfully to:
Please name your holdings portfolio
Type:
BUY
SELL
Date:
Amount:
Price
Point Value:
Leverage:
1:1
1:10
1:25
1:50
1:100
1:200
1:400
1:500
1:1000
Commission:
Create New Watchlist
Create
Create a new holdings portfolio
Add
Create
+ Add another position
Close
US2000
+0.87%
Add to/Remove from Watchlist
Add to Watchlist
Add Position
Position added successfully to:
Please name your holdings portfolio
Type:
BUY
SELL
Date:
Amount:
Price
Point Value:
Leverage:
1:1
1:10
1:25
1:50
1:100
1:200
1:400
1:500
1:1000
Commission:
Create New Watchlist
Create
Create a new holdings portfolio
Add
Create
+ Add another position
Close
IWM
+0.76%
Add to/Remove from Watchlist
Add to Watchlist
Add Position
Position added successfully to:
Please name your holdings portfolio
Type:
BUY
SELL
Date:
Amount:
Price
Point Value:
Leverage:
1:1
1:10
1:25
1:50
1:100
1:200
1:400
1:500
1:1000
Commission:
Create New Watchlist
Create
Create a new holdings portfolio
Add
Create
+ Add another position
Close
IXIC
+1.37%
Add to/Remove from Watchlist
Add to Watchlist
Add Position
Position added successfully to:
Please name your holdings portfolio
Type:
BUY
SELL
Date:
Amount:
Price
Point Value:
Leverage:
1:1
1:10
1:25
1:50
1:100
1:200
1:400
1:500
1:1000
Commission:
Create New Watchlist
Create
Create a new holdings portfolio
Add
Create
+ Add another position
Close
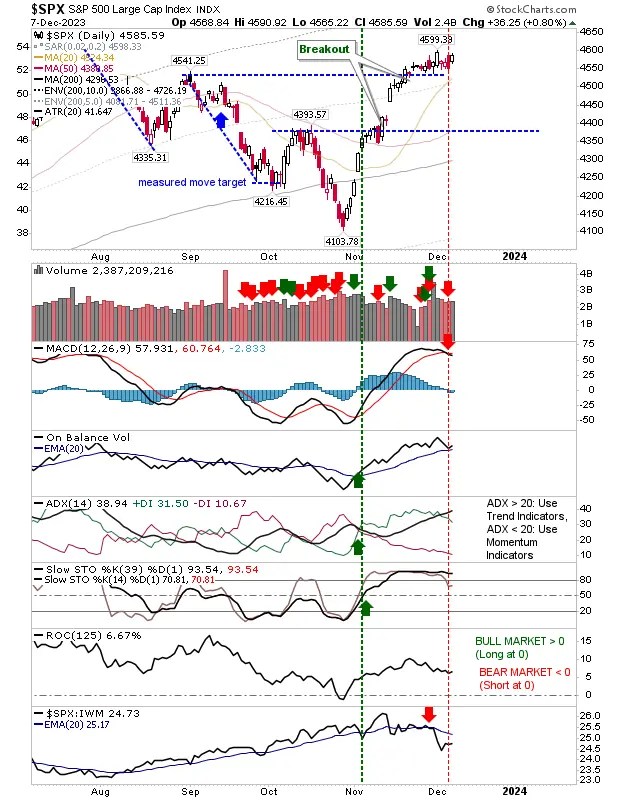
Markets are trading near resistance defined by recent swing highs, reversing early losses. The S&P 500 opened on resistance and posted a small gain.
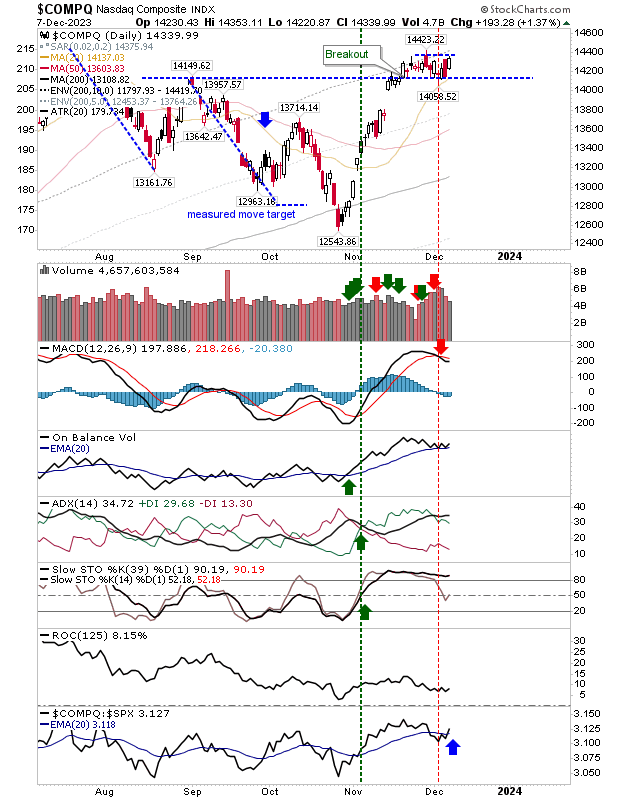
The Nasdaq had opened at support and has moved to trading range resistance.
In the process of making today’s gains, there was a switch in relative strength back in favor of the Tech index. There is still a MACD trigger ‘sell’ to negotiate, but this signal occurred well above the bullish zero line.
 COMPQ-Daily Chart
It’s a similar picture for the S&P 500 with a ‘sell’ trigger above the bullish zero line and it has moved to a relative period of underperformance against the Nasdaq and Russell 2000.
But of the indexes, it has the most room to support, and that’s more important than its relative technical underperformance to its peers.
 SPX-Daily Chart
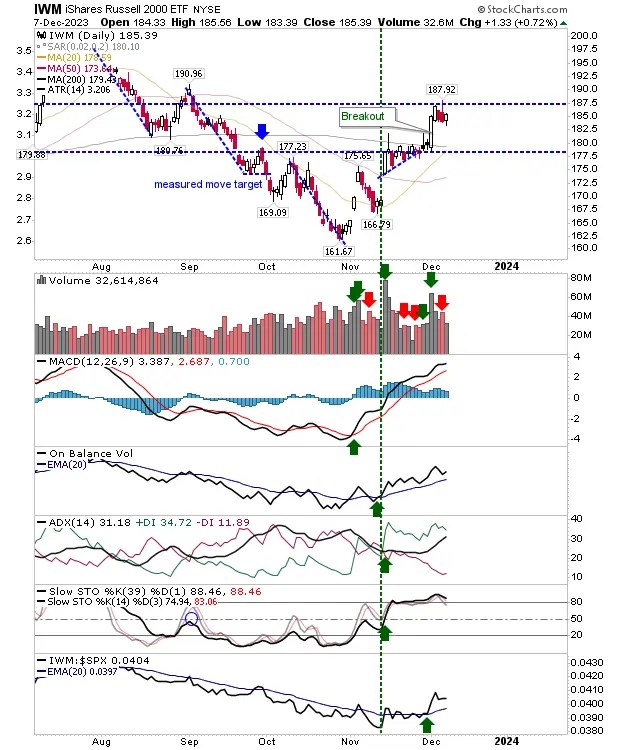
The Russell 2000 (IWM) has shaped a nice bullish ‘flag’ after clearing its 200-day MA.
I would be looking for a challenge of yesterday’s spike high as a minimum, but this is looking good for further gains as the index continues to shape a right-hand-side base.
 IWM-Daily Chart
It’s looking good for the indexes as we move closer to Santa rally time. I had thought the bears were ready to push their reversal yesterday, but they flaked out. So let’s see what bulls can do today.
Source: Investing.com


