US500
+0.20%
Add to/Remove from Watchlist
Add to Watchlist
Add Position
Position added successfully to:
Please name your holdings portfolio
Type:
BUY
SELL
Date:
Amount:
Price
Point Value:
Leverage:
1:1
1:10
1:25
1:50
1:100
1:200
1:400
1:500
1:1000
Commission:
Create New Watchlist
Create
Create a new holdings portfolio
Add
Create
+ Add another position
Close
MO
+0.18%
Add to/Remove from Watchlist
Add to Watchlist
Add Position
Position added successfully to:
Please name your holdings portfolio
Type:
BUY
SELL
Date:
Amount:
Price
Point Value:
Leverage:
1:1
1:10
1:25
1:50
1:100
1:200
1:400
1:500
1:1000
Commission:
Create New Watchlist
Create
Create a new holdings portfolio
Add
Create
+ Add another position
Close
WBA
+1.72%
Add to/Remove from Watchlist
Add to Watchlist
Add Position
Position added successfully to:
Please name your holdings portfolio
Type:
BUY
SELL
Date:
Amount:
Price
Point Value:
Leverage:
1:1
1:10
1:25
1:50
1:100
1:200
1:400
1:500
1:1000
Commission:
Create New Watchlist
Create
Create a new holdings portfolio
Add
Create
+ Add another position
Close
IVZ
+1.15%
Add to/Remove from Watchlist
Add to Watchlist
Add Position
Position added successfully to:
Please name your holdings portfolio
Type:
BUY
SELL
Date:
Amount:
Price
Point Value:
Leverage:
1:1
1:10
1:25
1:50
1:100
1:200
1:400
1:500
1:1000
Commission:
Create New Watchlist
Create
Create a new holdings portfolio
Add
Create
+ Add another position
Close
PXD
-1.36%
Add to/Remove from Watchlist
Add to Watchlist
Add Position
Position added successfully to:
Please name your holdings portfolio
Type:
BUY
SELL
Date:
Amount:
Price
Point Value:
Leverage:
1:1
1:10
1:25
1:50
1:100
1:200
1:400
1:500
1:1000
Commission:
Create New Watchlist
Create
Create a new holdings portfolio
Add
Create
+ Add another position
Close
SDY
+0.23%
Add to/Remove from Watchlist
Add to Watchlist
Add Position
Position added successfully to:
Please name your holdings portfolio
Type:
BUY
SELL
Date:
Amount:
Price
Point Value:
Leverage:
1:1
1:10
1:25
1:50
1:100
1:200
1:400
1:500
1:1000
Commission:
Create New Watchlist
Create
Create a new holdings portfolio
Add
Create
+ Add another position
Close
Several stocks in the S&P 500 index have an attractive dividend yield of over +8%.
Some of these stocks have underperformed the broader market this year.
In this piece, we will discuss 4 such stocks with massive dividend yields and decent upside potential.
This year has proven to be less than favorable for dividend investors. Here’s why:
Among the nearly 400 S&P 500 companies distributing dividends, 46% of them have witnessed a decline in their stock market performance this year.
A notable 75% of dividend-paying companies within the index have shown underperformance compared to the broader S&P 500.
The S&P Dividend ETF (NYSE:SDY) has experienced a year-to-date decline of more than -3.80%.
However, in the short term, the ETF has demonstrated positive returns, with a gain of +1.22% in the last three months and +6.34% in the last month.
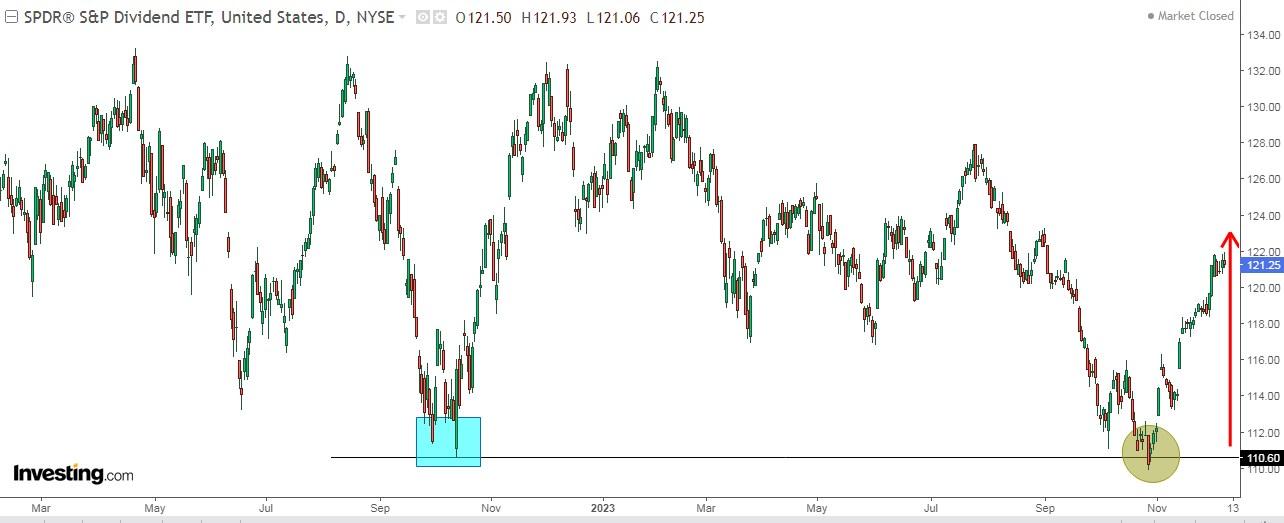 S&P Dividend ETF
In the following table, we can see some of the main dividend ETFs with their fee and 1-year to 5-year yields.
We see that all of them present spectacular 5-year yields. But on the other hand for 1 year, out of the 8, we have 3 negative returns and 2 with minor gains.
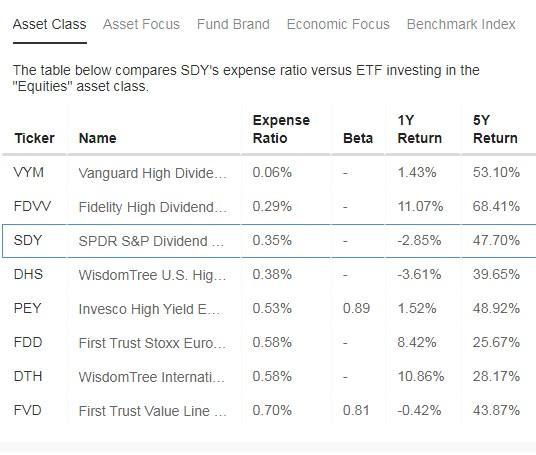 Dividend ETFs Comparison
Source: InvestingPro
But several stocks in the S&P 500 have a very attractive dividend yield, above +6%, that beat the average yield of companies on Wall Street and that the market likes.
Specifically, we will look at 4 stocks whose dividend yields more than +8%. To do so, we will use the InvestingPro tool to uncover insights about the stocks discussed below.
1. Pioneer Natural Resources
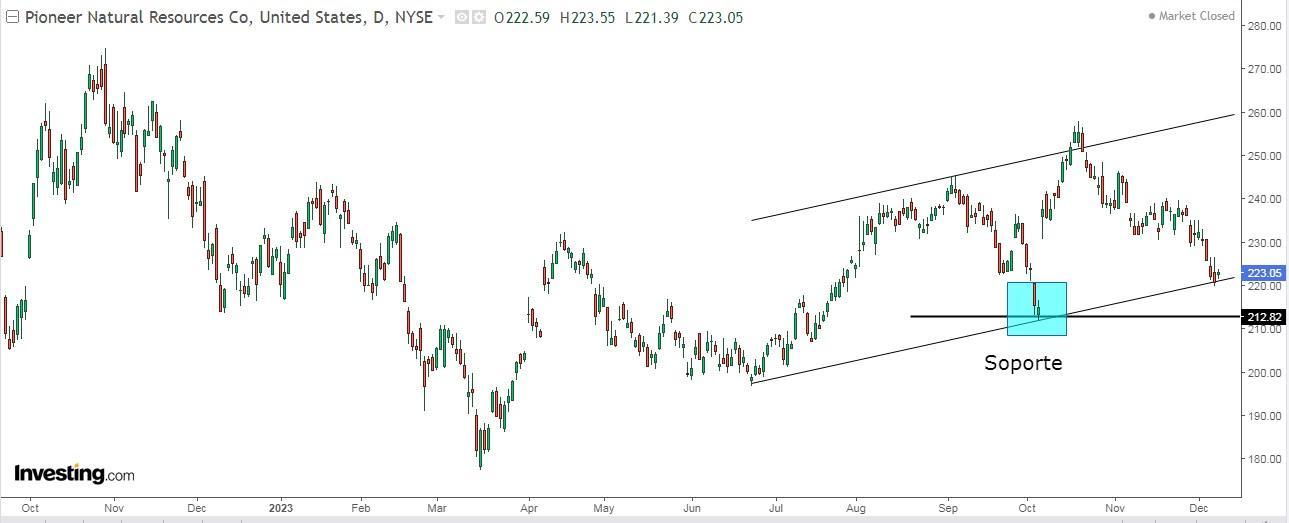 Pioneer Natural Resources Price Chart
Pioneer Natural Resources Co (NYSE:PXD) is based in Irving, Texas, it is engaged in hydrocarbon exploration. It was created in 1997 through the merger of Parker & Parsley Petroleum Company and MESA.
The dividend yield is +12.21%.
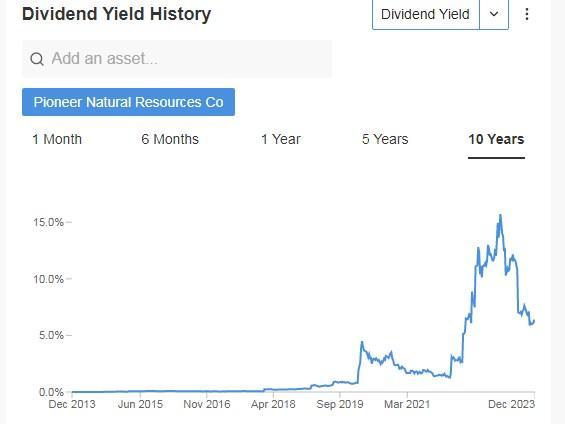 Pioneer Natural Resources Dividend History
Source: InvestingPro
On February 21 it presents its quarterly accounts. For 2024 it expects real revenue growth of +14.3% and earnings per share (EPS) of +11.5%.
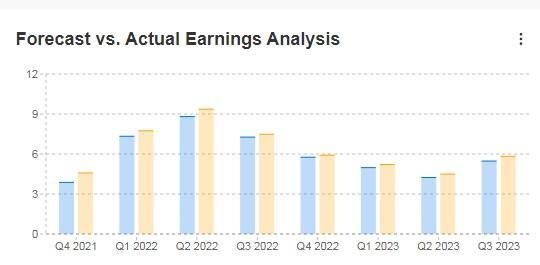 Pioneer Natural Resources Forecasts Vs. Actual Earnings
Source: InvestingPro
Its shares are up +8.69% in the last year. The market gives it a 12-month forward potential at $256.52, while InvestingPro’s models raise it to $266.87.
 Pioneer Natural Resources Analyst Targets
Source: InvestingPro
2. Walgreens Boots Alliance
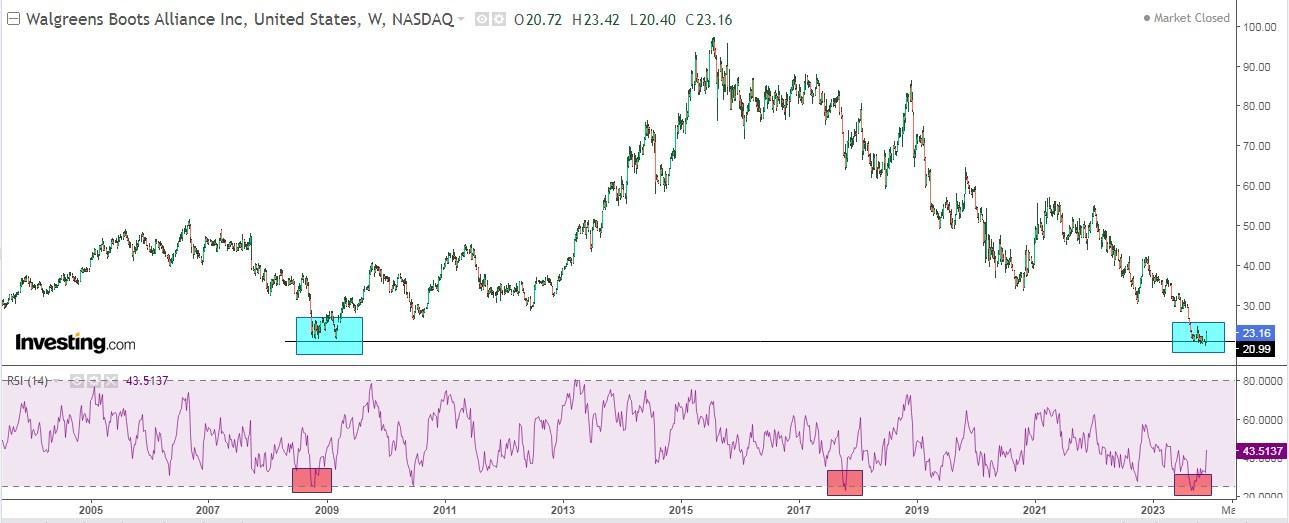 Walgreens Boots Alliance Price Chart
Walgreens Boots Alliance (NASDAQ:WBA) is a U.S. holding company based in Deerfield, Illinois that owns the Walgreens retail pharmacy chains in the United States and Boots in the United Kingdom, as well as several pharmaceutical manufacturing and distribution companies. The company was founded on December 31, 2014.
Its dividend yield is +9.36%.
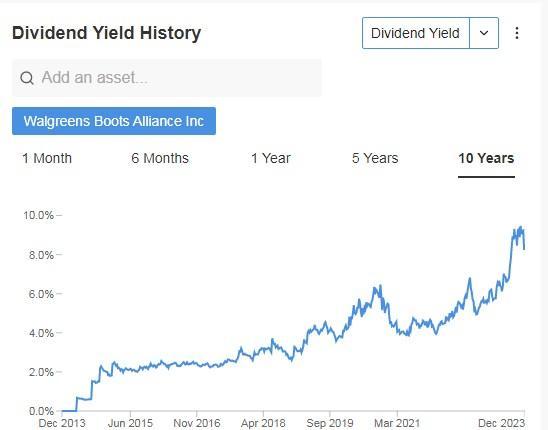 Walgreens Boots Alliance Dividend History
Source: InvestingPro
It reports quarterly results on January 4. For 2024, it expects real revenue growth of +2.8% and earnings per share (EPS) of +11.5%.
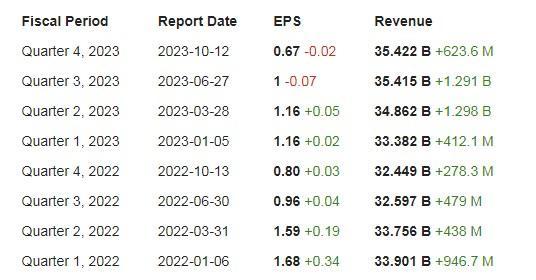 Walgreens Boots Alliance
Source: InvestingPro
Last Thursday its shares rose +8% following a New York court ruling that is expected to address the admissibility of evidence on the safety of Tylenol when used by pregnant women.
Its shares are up +10.63% over the past 3 months and +14.82% over the past month. The market sees a 12-month potential for it at $27.
 Walgreens Boots Alliance Targets
Source: InvestingPro
3. Altria Group
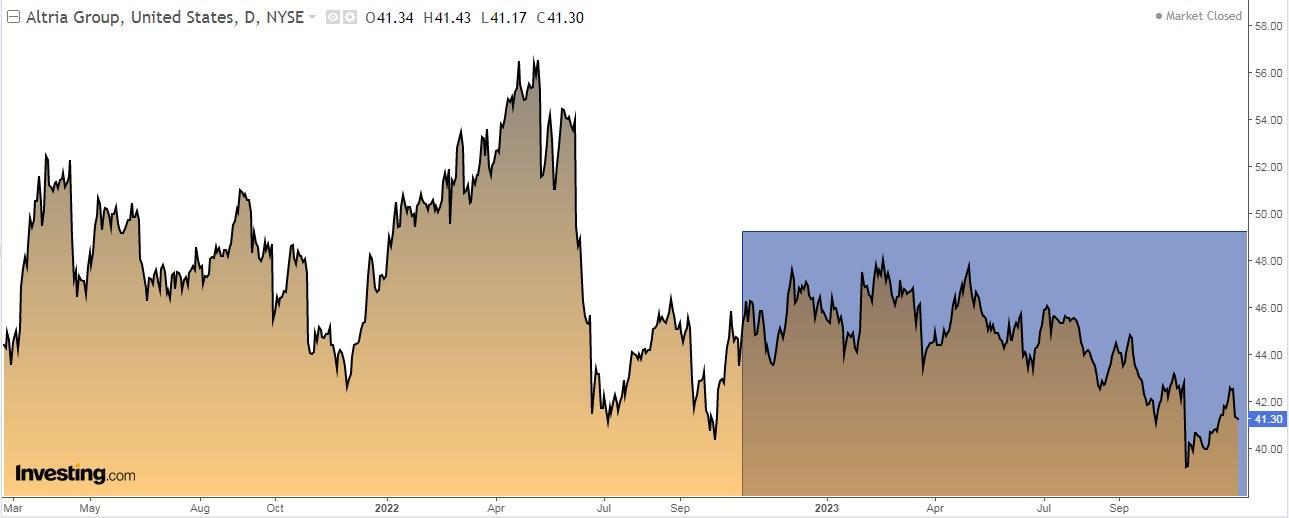 Altria Group Price Chart
Altria Group (NYSE:MO) is one of the largest U.S. transnational companies and markets mainly food, beverages, and tobacco.
The companies that are part of the Altria Group are: Philip Morris (NYSE:PM), Smokeless Tobacco Company, John Middleton, Philip Morris, and Nu Mark. It is headquartered in Virginia.
Its dividend yield is +9.21%. The dividend will be paid on January 10, 2024, to shareholders with shares before December 21, 2023.
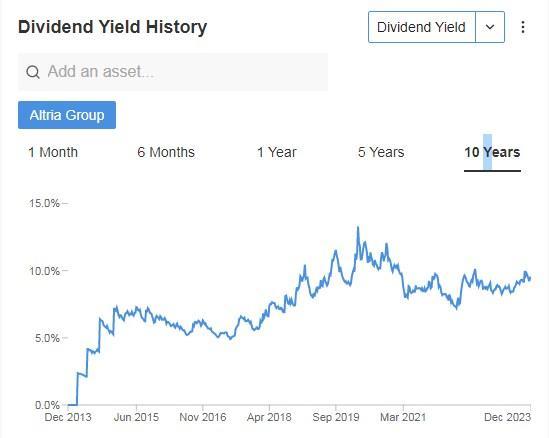 Altria Group Dividend History
Source: InvestingPro
Results for the quarter will be released on February 1. For the 2023 computation, EPS is expected to increase by +2.4% and for 2023 by +3%.
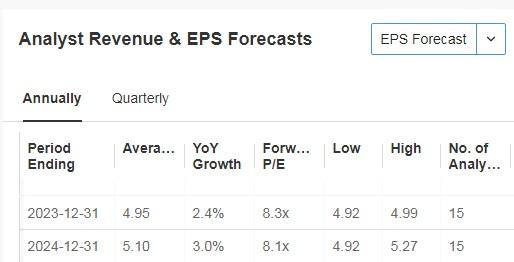 Altria Group Revenue and EPS Forecasts
Source: InvestingPro
Its shares are up +3.20% in the last month. The market gives it a 12-month potential at $47.04 and InvestingPro models at $55.16.
 Altria Group Targets
Source: InvestingPro
4. Invesco
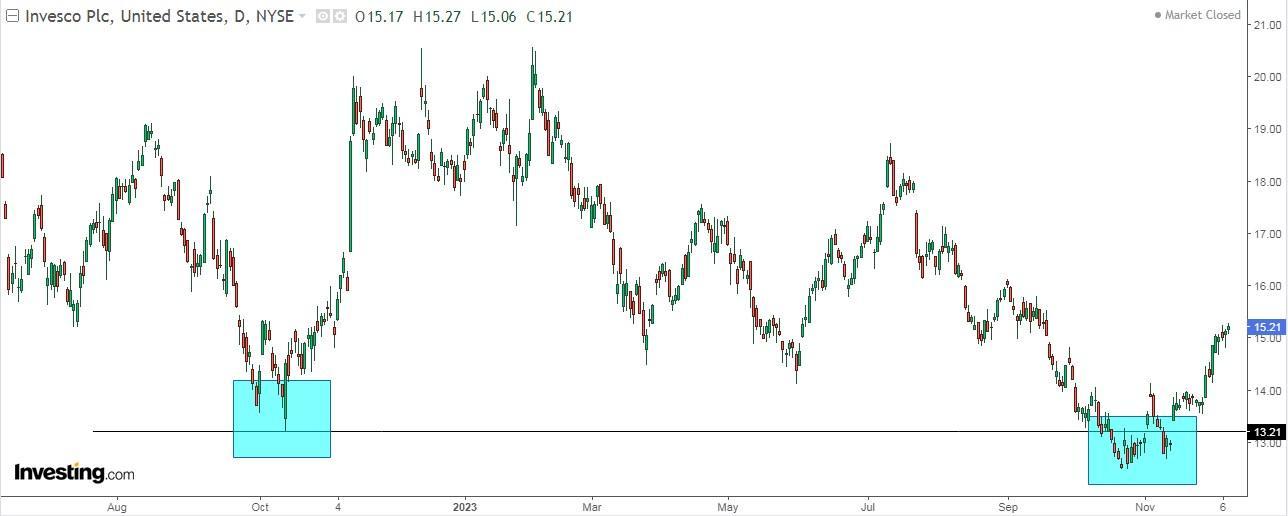 Invesco Price Chart
Invesco Plc (NYSE:IVZ) is one of the world’s leading independent investment managers and also launches mutual funds. Invesco was founded in 1969 and has a presence in 25 countries and employs more than 8,000 professionals.
Its dividend yield is +8.27%.
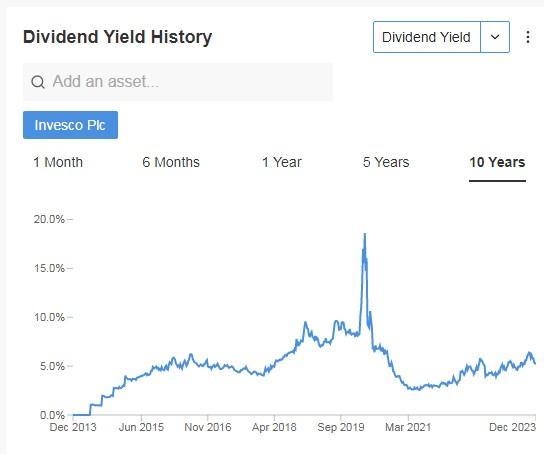 Invesco Dividend History
Source: InvestingPro
On January 31, it is due to release its quarterly accounts. For 2024, earnings per share are expected to increase by +13.2%.
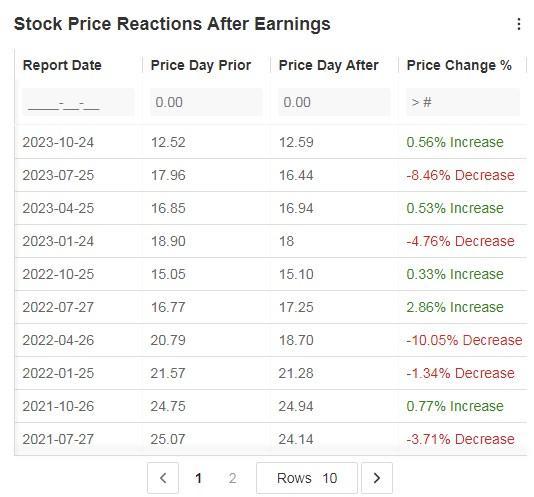 Invesco Stock Price Reaction Post Earnings
Source: InvestingPro
Its shares are up +17.28% in the last month. It presents 15 ratings, of which 2 are buy, 13 are hold and none are sell. InvestingPro models give it a potential at $17.47.
 Invesco Investing Models
Source: InvestingPro
***
You can easily determine whether a company is suitable for your risk profile by conducting a detailed fundamental analysis on InvestingPro according to your criteria. This way, you will get highly professional help in shaping your portfolio.
You can sign up for InvestingPro, one of the most comprehensive platforms in the market for portfolio management and fundamental analysis by clicking on the banner below.
Find All the Info you Need on InvestingPro!
Disclaimer: This article is written for informational purposes only; it does not constitute a solicitation, offer, advice, or recommendation to invest as such it is not intended to incentivize the purchase of assets in any way. I would like to remind you that any type of asset, is evaluated from multiple points of view and is highly risky therefore, any investment decision and the associated risk remains with the investor.
Source: Investing.com


