NDX
+0.52%
Add to/Remove from Watchlist
Add to Watchlist
Add Position
Position added successfully to:
Please name your holdings portfolio
Type:
BUY
SELL
Date:
Amount:
Price
Point Value:
Leverage:
1:1
1:10
1:25
1:50
1:100
1:200
1:400
1:500
1:1000
Commission:
Create New Watchlist
Create
Create a new holdings portfolio
Add
Create
+ Add another position
Close
US500
-0.01%
Add to/Remove from Watchlist
Add to Watchlist
Add Position
Position added successfully to:
Please name your holdings portfolio
Type:
BUY
SELL
Date:
Amount:
Price
Point Value:
Leverage:
1:1
1:10
1:25
1:50
1:100
1:200
1:400
1:500
1:1000
Commission:
Create New Watchlist
Create
Create a new holdings portfolio
Add
Create
+ Add another position
Close
DJI
+0.15%
Add to/Remove from Watchlist
Add to Watchlist
Add Position
Position added successfully to:
Please name your holdings portfolio
Type:
BUY
SELL
Date:
Amount:
Price
Point Value:
Leverage:
1:1
1:10
1:25
1:50
1:100
1:200
1:400
1:500
1:1000
Commission:
Create New Watchlist
Create
Create a new holdings portfolio
Add
Create
+ Add another position
Close
US2000
-0.77%
Add to/Remove from Watchlist
Add to Watchlist
Add Position
Position added successfully to:
Please name your holdings portfolio
Type:
BUY
SELL
Date:
Amount:
Price
Point Value:
Leverage:
1:1
1:10
1:25
1:50
1:100
1:200
1:400
1:500
1:1000
Commission:
Create New Watchlist
Create
Create a new holdings portfolio
Add
Create
+ Add another position
Close
IWM
-0.84%
Add to/Remove from Watchlist
Add to Watchlist
Add Position
Position added successfully to:
Please name your holdings portfolio
Type:
BUY
SELL
Date:
Amount:
Price
Point Value:
Leverage:
1:1
1:10
1:25
1:50
1:100
1:200
1:400
1:500
1:1000
Commission:
Create New Watchlist
Create
Create a new holdings portfolio
Add
Create
+ Add another position
Close
IXIC
+0.35%
Add to/Remove from Watchlist
Add to Watchlist
Add Position
Position added successfully to:
Please name your holdings portfolio
Type:
BUY
SELL
Date:
Amount:
Price
Point Value:
Leverage:
1:1
1:10
1:25
1:50
1:100
1:200
1:400
1:500
1:1000
Commission:
Create New Watchlist
Create
Create a new holdings portfolio
Add
Create
+ Add another position
Close
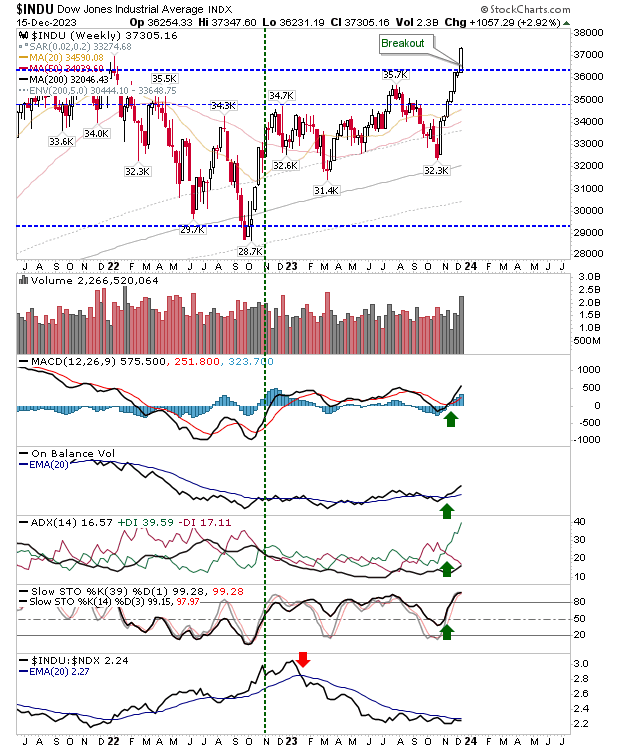
It was a classic breakout for the Dow as the index recorded a new all-time high.
Weekly buying volume was the highest since January 2022. Technicals are net positive with the index shifting to a relative outperformance against the Nasdaq 100.
 INDU-Weekly Chart
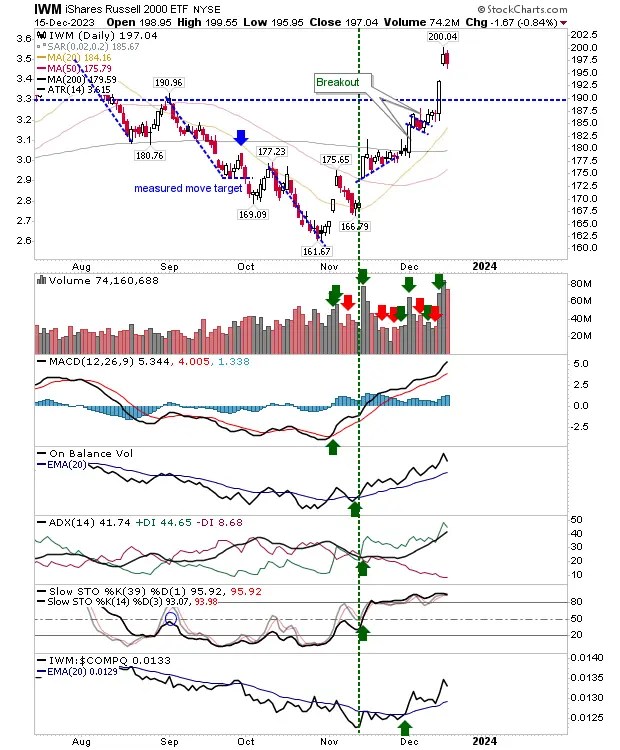
On daily timeframes, the action was more mixed. I had expected the Nasdaq to be the index to come under selling pressure, but in the end, it was the Russell 2000 (IWM) that took the hit.
There is still a large trading gap to close that will act as a vacuum once prices drift into it. Despite this, selling volume was down on the previous week’s buying.
 IWM-Daily Chart
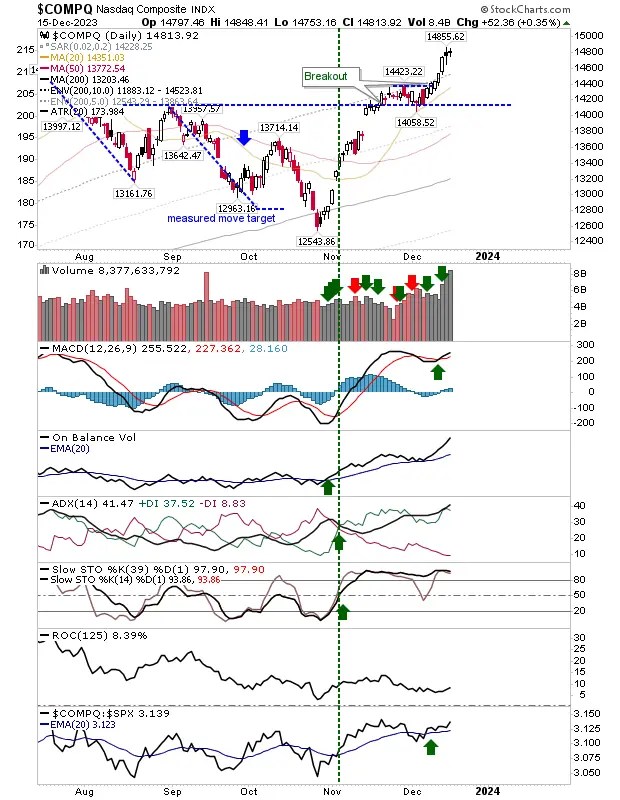
The Nasdaq closed with an indecisive doji on higher volume (options expiration). The index is outperforming the S&P 500, but this could still go either way.
 COMPQ-Daily Chart
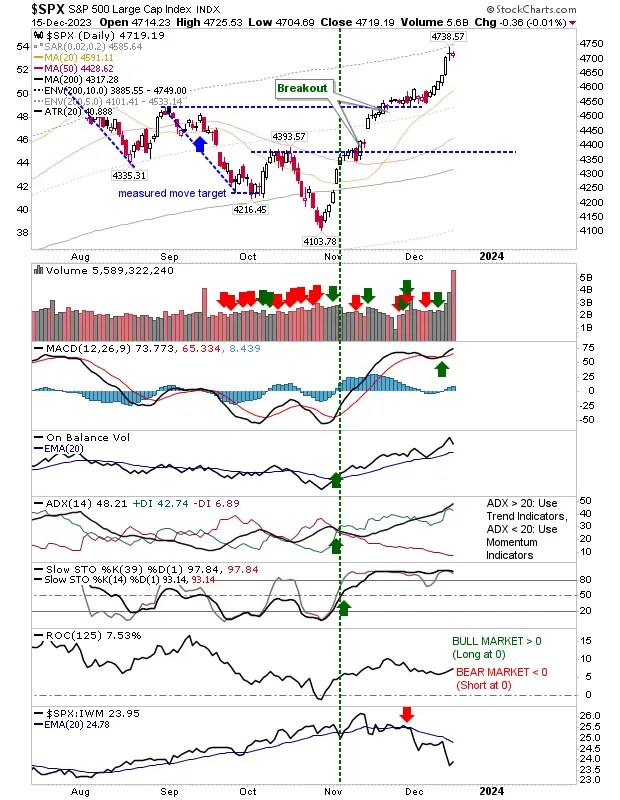
The S&P 500 had already slowed the advance of its gains from Thursday, before marking a continued period of indecision Friday with a narrow range “spinning top”.
Volume surged to the highest in years on options expiration, but sellers have been unable to reverse the October-December trend.
Whether they can do so this week remains to be seen, but with the Santa rally to come, it would appear any concerted selling won’t happen until the new year.
 SPX-Daily Chart
With Christmas fast approaching I will be looking for a generally bullish bias into the New Year. However, at the start of 2024, I suspect the hangover off the back of a strong end-of-year will kick in and sellers will be much more aggressive.
However, with indices touching new all-time highs, the bear market that kicked in in 2021 appears to be over and a new secular bull market looks ready to go.
A worst-case scenario would be a trading range between September 2022 lows and 2021 highs, but let’s see what Q1 2024 brings.
Source: Investing.com


