CL
+0.12%
Add to/Remove from Watchlist
Add to Watchlist
Add Position
Position added successfully to:
Please name your holdings portfolio
Type:
BUY
SELL
Date:
Amount:
Price
Point Value:
Leverage:
1:1
1:10
1:25
1:50
1:100
1:200
1:400
1:500
1:1000
Commission:
Create New Watchlist
Create
Create a new holdings portfolio
Add
Create
+ Add another position
Close
Crude oil ended a seven-week decline last week, supported by easing demand concerns.
Despite a shaky start this week, oil prices show potential for a bullish reversal, indicated by technical signals, including a hammer candle on the weekly chart.
Risks in the oil market favor an upside scenario, backed by ongoing OPEC+ supply cuts and potential further measures.
Crude oil closed last week in the positive territory for the first time after 7 consecutive weekly falls. Prices finally found some support as demand concernes eased.
After a bright start to the new week, oil prices had again turned lower at the time of writing in early European session, casting some doubts over bullish signals that had emerged last week.
Still, the weakness may attract dip-buyers later in the day or week, in light of the apparent bullish reversal in oil prices last week.
Before discussing the macro factors, let’s start by looking at the charts first.
Crude Oil Technical View
Despite a weaker start at the beginning of this week, we may have already seen a potential low in oil prices last week judging by the technical signals that were formed then.
But some upside follow-through is needed to confirm that reversal, which was always needed but especially in light of a weaker start today.
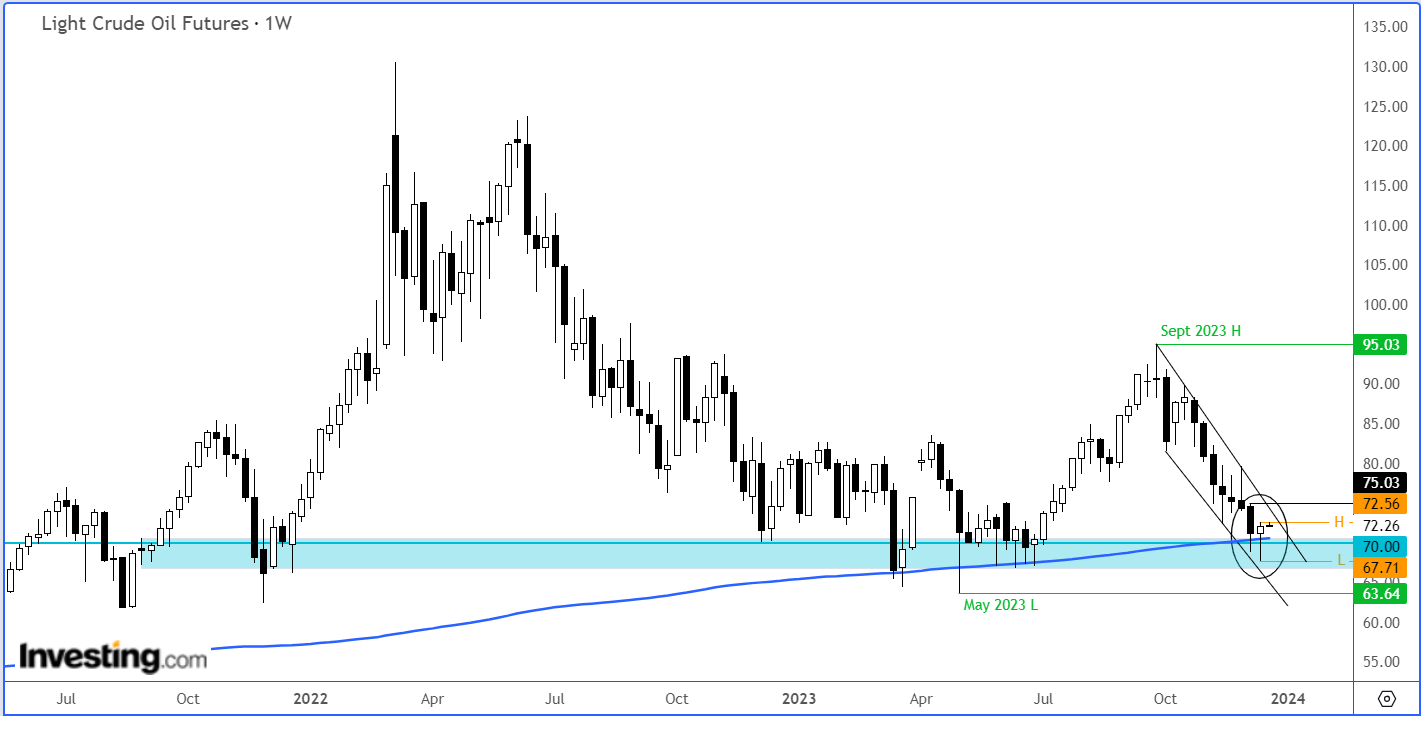
 Light Crude Oil Futures Weekly Chart
As per the weekly chart, WTI formed a hammer candle on the weekly time frame. The hammer pattern is a single-candle bullish reversal pattern. It is often found at the end of a downtrend.
The opening price is usually below the close, while there is a long wick that extends lower, which is at least twice as big as the shorter body of the candle.
But all you need to know is that this pattern usually precedes more gains as it shows a reversal from previous selling pressure to now buying pressure.
The reversal happened as oil prices dipped more than $2 below the key $70 handle, but ultimately closed the week about $2 above this psychologically-important level.
The fact that this hammer candle was formed around the rising 200-week average makes it even more interesting from a bullish point of view.
What the bulls will want to see next is some traction above last week’s high at $72.56.
A break above the resistance trend of the bearish channel would be ideal, while a potential move above the prior week’s high at around $75 would create a three-bar bullish reversal pattern.
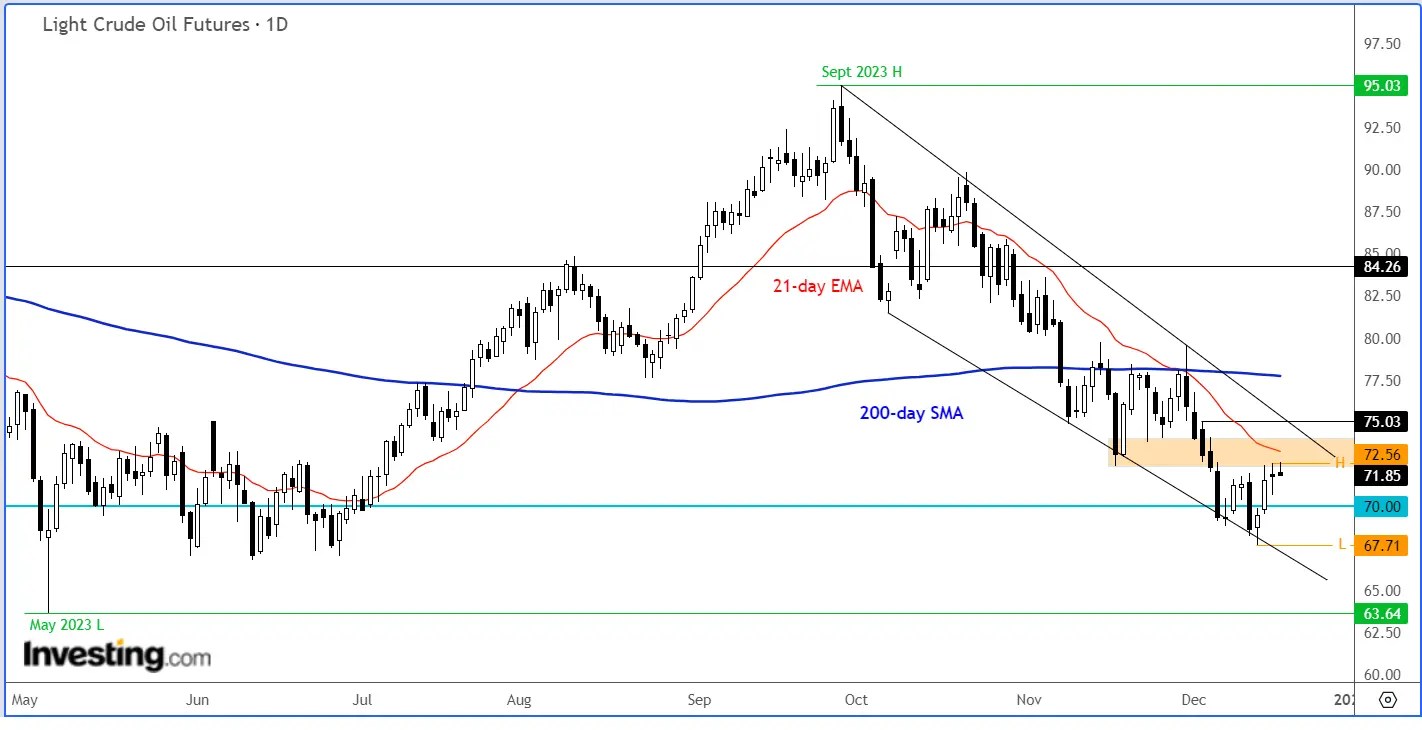
Zooming into the daily time frame reveals more complexities. The shaded orange area, which is where the high of last week was also formed inside, marks a previous support zone and where the downward-sloping 21-day exponential moving average comes into play.
Given that the trend has been bearish since prices peaked in September, it is important to proceed with extra care while oil is below or within this zone.
 Light Crude Oil Futures Daily Chart
So, there is a possibility that oil has bottomed, but some bullish price action is needed for confirmation. A clean break above last week’s range – and the overnight high – is now needed to trigger a potential rally now.
Risks Remain Tilted to the Upside
As I wrote on oil last week, the early momentum did fade, before prices reversed to close the week higher. I have been leaning more towards a bullish reversal in recent days because of oversold prices in what is an overall bullish macro environment.
Yes, there are some concerns over demand while the efficacy of the supply cuts from the OPEC+ has come under some scrutiny, but at the very least it looks like the worst of the sell-off may be behind us now, after what has been a brutal couple of months.
The ongoing supply cuts from OPEC and allies should keep the downside limited from here on. If anything, the risks are skewed given the bullish reversal signals from last week’s price action.
It is also worth remembering that the severity of the oil price decline may not be entirely justified, given the demand-inelastic nature of oil prices.
In this context, the supply side of the equation holds more influence. If OPEC takes additional measures to stabilize prices, this could be a major source of support to prices.
Recent remarks from Saudi Arabia’s energy minister suggest the possibility of extending or deepening supply cuts beyond Q1. Russia on Sunday said that it would deepen oil export cuts in December by a possible 50,000 barrels per day or more.
So, the OPEC+ is doing all it can to support prices. I wouldn’t fight against them in thinking they won’t be successful.
Even without any further additional cuts from the OPEC+, they are already doing a lot in terms of withholding supplies. As demand recovers, prices should start pushing higher again.
Why Did Crude Oil Prices Fall Sharply?
Before last week’s reversal, oil prices had fallen for 7 straight weeks. The drop followed the voluntary output cuts that were made by OPEC+ a couple of weeks ago, which left the markets unimpressed.
The sell-off gained momentum as successive support levels succumbed, giving rise to more technical selling.
As well as doubts regarding the effectiveness of OPEC’s recent output cuts, investors have also been concerned by the continuous growth in US crude exports, pointing to excessive non-OPEC supplies.
On top of this, fears about demand have also played a big part in the recent drop. The global economy remains stagnant due to elevated interest rates, while the lingering impact of past inflation spikes continues to negatively affect both consumers and businesses.
***
You can easily determine whether a company is suitable for your risk profile by conducting a detailed fundamental analysis on InvestingPro according to your criteria. This way, you will get highly professional help in shaping your portfolio.
In addition, you can sign up for InvestingPro, one of the most comprehensive platforms in the market for portfolio management and fundamental analysis, much cheaper with the biggest discount of the year (up to 60%), by taking advantage of our extended Cyber Monday deal.
Claim Your Discount Today!
Disclaimer: This article is written for informational purposes only; it does not constitute a solicitation, offer, advice, or recommendation to invest as such it is not intended to incentivize the purchase of assets in any way. I would like to remind you that any type of asset, is evaluated from multiple points of view and is highly risky and therefore, any investment decision and the associated risk remains with the investor.
Read my articles at City Index
Source: Investing.com


