2/2

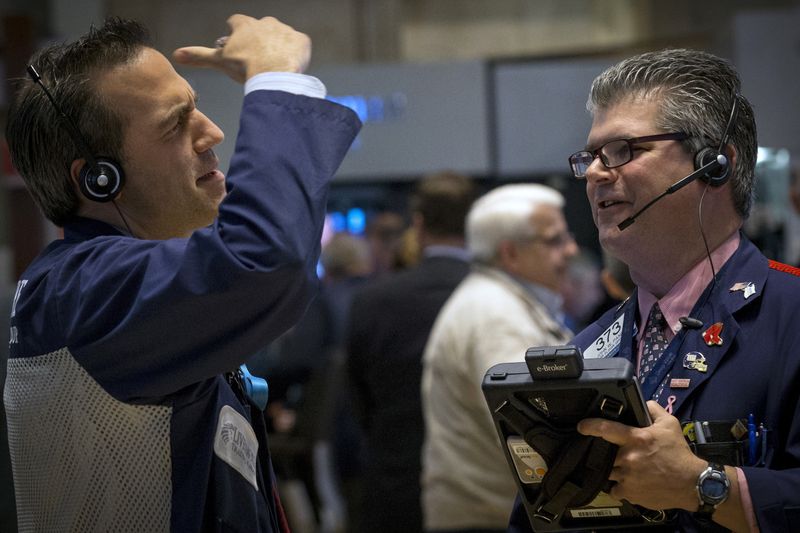
© Reuters. Traders work on the floor of the New York Stock Exchange May 15, 2015. REUTERS/Brendan McDermid/File Photo
2/2
US500
+0.57%
Add to/Remove from Watchlist
Add to Watchlist
Add Position
Position added successfully to:
Please name your holdings portfolio
Type:
BUY
SELL
Date:
Amount:
Price
Point Value:
Leverage:
1:1
1:10
1:25
1:50
1:100
1:200
1:400
1:500
1:1000
Commission:
Create New Watchlist
Create
Create a new holdings portfolio
Add
Create
+ Add another position
Close
MSFT
+1.56%
Add to/Remove from Watchlist
Add to Watchlist
Add Position
Position added successfully to:
Please name your holdings portfolio
Type:
BUY
SELL
Date:
Amount:
Price
Point Value:
Leverage:
1:1
1:10
1:25
1:50
1:100
1:200
1:400
1:500
1:1000
Commission:
Create New Watchlist
Create
Create a new holdings portfolio
Add
Create
+ Add another position
Close
AAPL
+0.41%
Add to/Remove from Watchlist
Add to Watchlist
Add Position
Position added successfully to:
Please name your holdings portfolio
Type:
BUY
SELL
Date:
Amount:
Price
Point Value:
Leverage:
1:1
1:10
1:25
1:50
1:100
1:200
1:400
1:500
1:1000
Commission:
Create New Watchlist
Create
Create a new holdings portfolio
Add
Create
+ Add another position
Close
NVDA
+3.58%
Add to/Remove from Watchlist
Add to Watchlist
Add Position
Position added successfully to:
Please name your holdings portfolio
Type:
BUY
SELL
Date:
Amount:
Price
Point Value:
Leverage:
1:1
1:10
1:25
1:50
1:100
1:200
1:400
1:500
1:1000
Commission:
Create New Watchlist
Create
Create a new holdings portfolio
Add
Create
+ Add another position
Close
GME
+2.20%
Add to/Remove from Watchlist
Add to Watchlist
Add Position
Position added successfully to:
Please name your holdings portfolio
Type:
BUY
SELL
Date:
Amount:
Price
Point Value:
Leverage:
1:1
1:10
1:25
1:50
1:100
1:200
1:400
1:500
1:1000
Commission:
Create New Watchlist
Create
Create a new holdings portfolio
Add
Create
+ Add another position
Close
US10Y…
-0.23%
Add to/Remove from Watchlist
Add to Watchlist
Add Position
Position added successfully to:
Please name your holdings portfolio
Type:
BUY
SELL
Date:
Amount:
Price
Point Value:
Leverage:
1:1
1:10
1:25
1:50
1:100
1:200
1:400
1:500
1:1000
Commission:
Create New Watchlist
Create
Create a new holdings portfolio
Add
Create
+ Add another position
Close
By Lewis Krauskopf
NEW YORK (Reuters) – As the S&P 500 continues to hit fresh milestones with a first-ever break above the 5,000 level, its valuation is reaching new heights as well.
The S&P 500’s forward price-to-earnings ratio — a commonly used metric to value stocks — this week rose to 20.4 times, a level last reached in February 2022, according to LSEG Datastream. That puts it far above the index’s historic average of 15.7.
It isn’t unusual for valuations to climb along with stock prices, and equities can stay expensive for a long time before returning to more moderate levels. Still, some investors believe the index’s growing multiple has made buying into the broad market a less enticing proposition. The S&P 500 has surged 21% since late October, making new record highs along the way.
It briefly crossed the 5,000 level at the end of Thursday’s session, before closing just below the mark.
“There is nothing screaming from the rooftops that at 20 times you have to sell,” said Mark Hackett, chief of investment research at Nationwide. “It’s just you’d obviously rather buy at 15 times.”
Stock valuations have risen even as Treasury yields have rebounded this year, following a rethink of how soon the U.S. Federal Reserve will begin cutting interest rates
Higher yields tend to pressure equity valuations as it means bonds are offering more investment competition to stocks and that future company cash flows are valued less highly. That means stock valuations could rise further if the Fed delivers its widely expected cuts and yields fall. The 10-year Treasury yield was last around 4.16%.
And while a more optimistic earnings outlook would help make valuations less expensive, profit expectations for 2024 have largely stayed stable this earnings season as companies have reported results. S&P 500 companies are expected to increase earnings by 9.7% this year, LSEG data showed.
Peter Tuz, president of Chase Investment Counsel, has been looking this reporting season for companies with solid earnings prospects that are not expensive.
The S&P 500’s “valuation at roughly 20 times … is somewhat excessive and is based on either earnings growth or falling rates that we might not see until the latter parts of this year,” he said.
High valuations have preceded periods of subpar performance in the past, according to research from Evercore ISI. The S&P 500 has been flat on average over the next year when it traded at its current valuation of 22 times its trailing twelve month earnings, wrote Julian Emanuel, a senior managing director at the firm, in a Wednesday note analyzing data going back to 1960.
“The good news is that valuations, while stretched … are nowhere near the 28x peak at the Y2K Bubble Top,” Emanuel said.
To be sure, the S&P 500’s valuation is skewed by the heavy weighting of the index’s largest stocks. The so-called Magnificent Seven group of megacap stocks – which includes Apple (NASDAQ:AAPL), Microsoft (NASDAQ:MSFT) and Nvidia (NASDAQ:NVDA) – have a combined weighting of 29% in the index and trade at an average of 34 times earnings, according to LSEG Datastream data.
At the same time, there have been fewer signs of the speculative excesses that marked past market turning points, such as the dot-com era and the wild post-pandemic rally that brought eye-watering gains in so-called meme stocks such as GameStop (NYSE:GME).
An analysis by Ned Davis Research showed that the S&P 500 is more than 5% “overvalued,” when adjusted for how the index’s P/E ratio has trended since 1964. However, the index is “far from bubble territory,” the firm said.
Source: Investing.com


