US500
-0.09%
Add to/Remove from Watchlist
Add to Watchlist
Add Position
Position added successfully to:
Please name your holdings portfolio
Type:
BUY
SELL
Date:
Amount:
Price
Point Value:
Leverage:
1:1
1:10
1:25
1:50
1:100
1:200
1:400
1:500
1:1000
Commission:
Create New Watchlist
Create
Create a new holdings portfolio
Add
Create
+ Add another position
Close
NVDA
+0.16%
Add to/Remove from Watchlist
Add to Watchlist
Add Position
Position added successfully to:
Please name your holdings portfolio
Type:
BUY
SELL
Date:
Amount:
Price
Point Value:
Leverage:
1:1
1:10
1:25
1:50
1:100
1:200
1:400
1:500
1:1000
Commission:
Create New Watchlist
Create
Create a new holdings portfolio
Add
Create
+ Add another position
Close
US10Y…
+2.68%
Add to/Remove from Watchlist
Add to Watchlist
Add Position
Position added successfully to:
Please name your holdings portfolio
Type:
BUY
SELL
Date:
Amount:
Price
Point Value:
Leverage:
1:1
1:10
1:25
1:50
1:100
1:200
1:400
1:500
1:1000
Commission:
Create New Watchlist
Create
Create a new holdings portfolio
Add
Create
+ Add another position
Close
VIX
+4.02%
Add to/Remove from Watchlist
Add to Watchlist
Add Position
Position added successfully to:
Please name your holdings portfolio
Type:
BUY
SELL
Date:
Amount:
Price
Point Value:
Leverage:
1:1
1:10
1:25
1:50
1:100
1:200
1:400
1:500
1:1000
Commission:
Create New Watchlist
Create
Create a new holdings portfolio
Add
Create
+ Add another position
Close
It was a mixed day of trading as rising implied volatility appeared to finally reach a level that was determinantal for stocks to continue to push higher.
You won’t see it on the VIX index, but you will see it when looking at an at-the-money 1-month Nvidia (NASDAQ:NVDA) option that climbed to 61.7% yesterday.
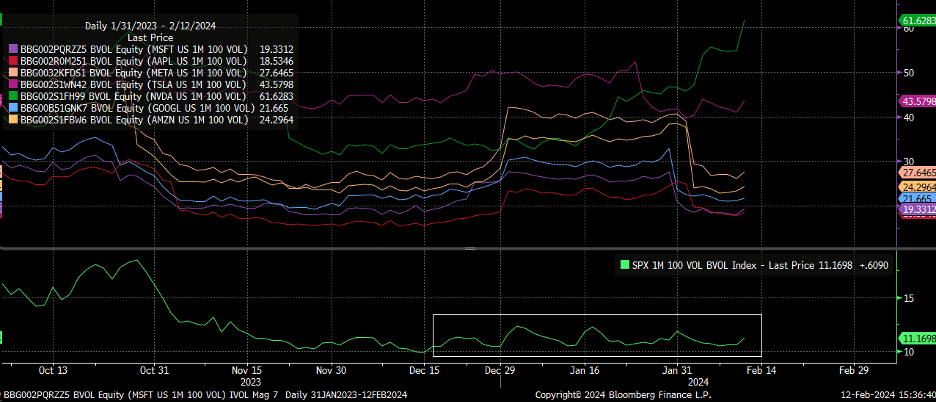 MSFT-Chart
It is a sight to behold, as it is not something you see like this often.
That rising IV in sync with the rising stock price is about as clear a sign as any as to what is happening with Nvidia’s stock, which is a frenzy and demand of call buying lifting the shares higher, and as a result the broader indexes with it.
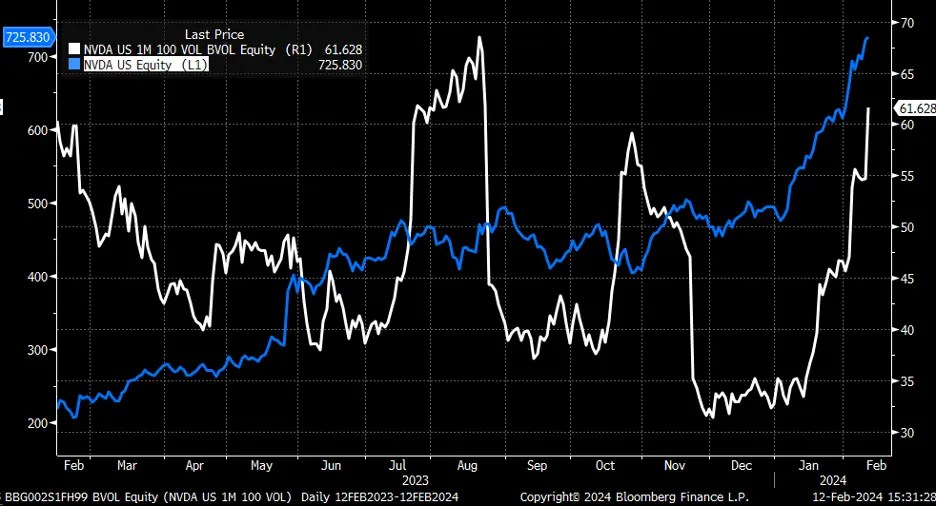 NVDA Volume Chart
The move higher in IV of the stocks in the MAG7 and the S&P 500 got the Implied Correlations indexes higher for 1,3,9, and 12 months.
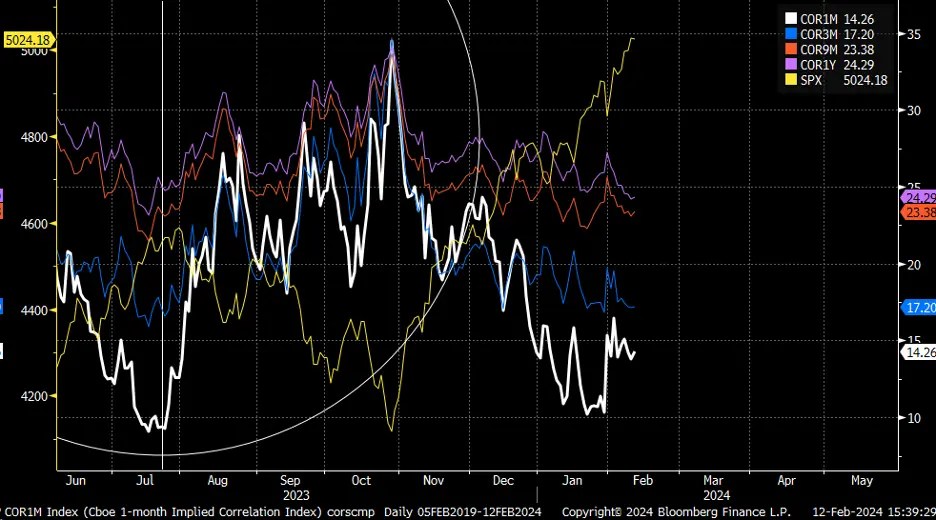 1-Month Implied Correlation Index
The entire implied volatility term structure moved higher yesterday, with the biggest moves higher coming from the front of the curve, likely due to some hedging activity for the CPI report today.
It seems likely that IV should fall today once the CPI data is released unless there is a reason for implied volatility to rise following the report, which will depend on the data itself.
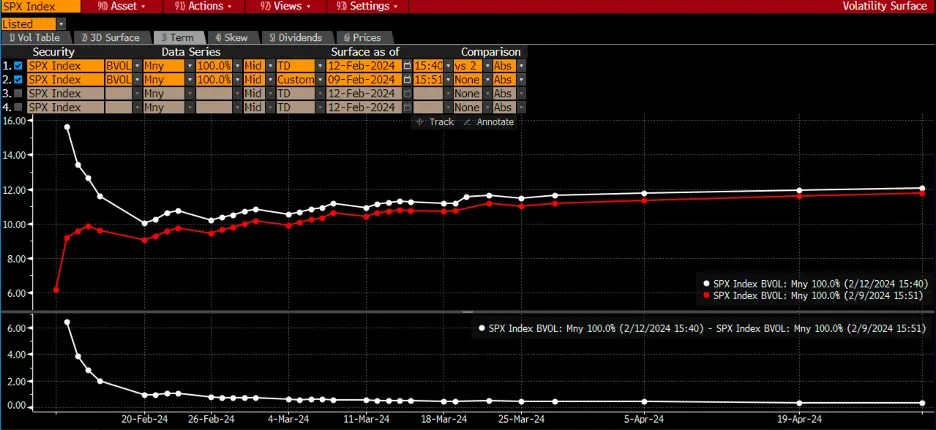 SPX Index
Yesterday, we finally saw the rising wedge break, with an initial throwover that turned lower through the lower bound.
If it is a rising wedge that has officially broken, then we should see follow-through today and in the coming days, taking the S&P 500 back to the origin for the rising wedge to 4,850. After that, we will have to see what happens.
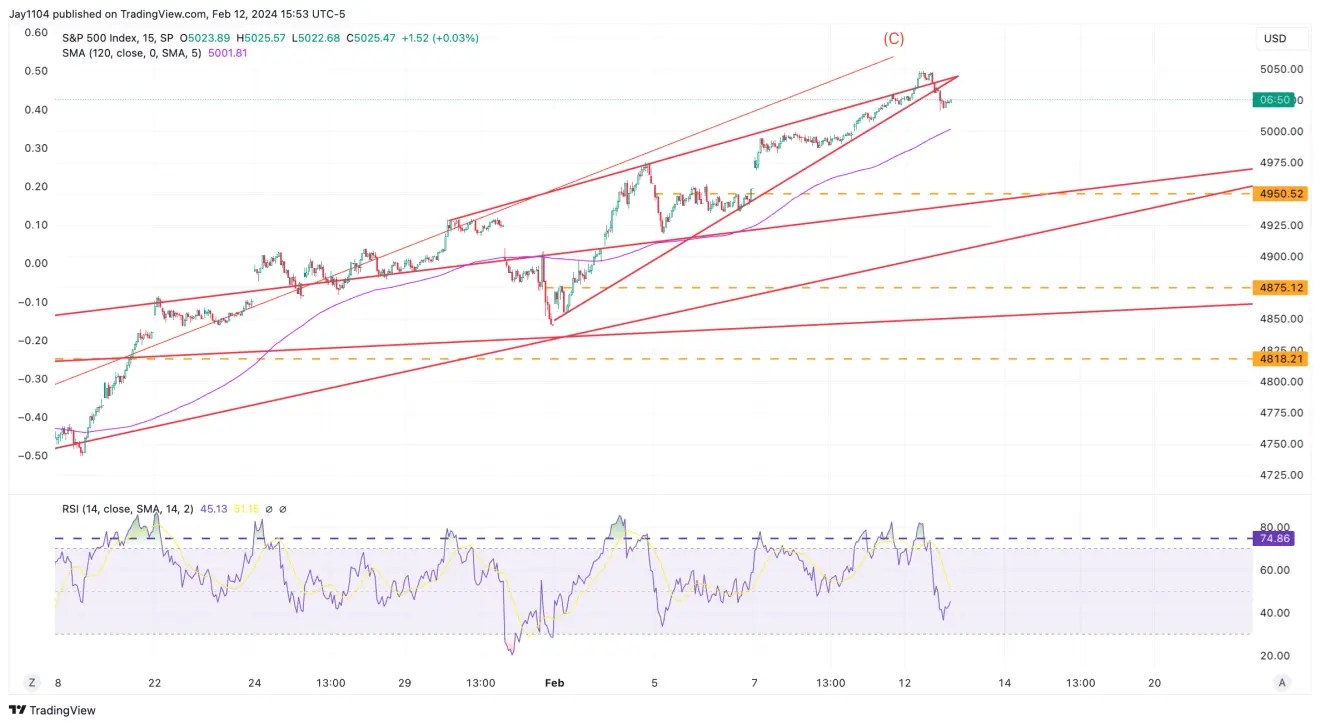 S&P 500 Index-15-Minute Chart
The 10-year rate has not broken up and out, but I think today’s data and the data to follow the rest of the week will likely result in the 10-year either breaking out and moving sharply higher or moving back towards the 3.8% region.
The thing is that rates have a few chances to move lower, including a solid 10-year auction last week and favorable CPI revisions, but we haven’t seen rates move down either. So, my feeling is that bias is for rates to rise.
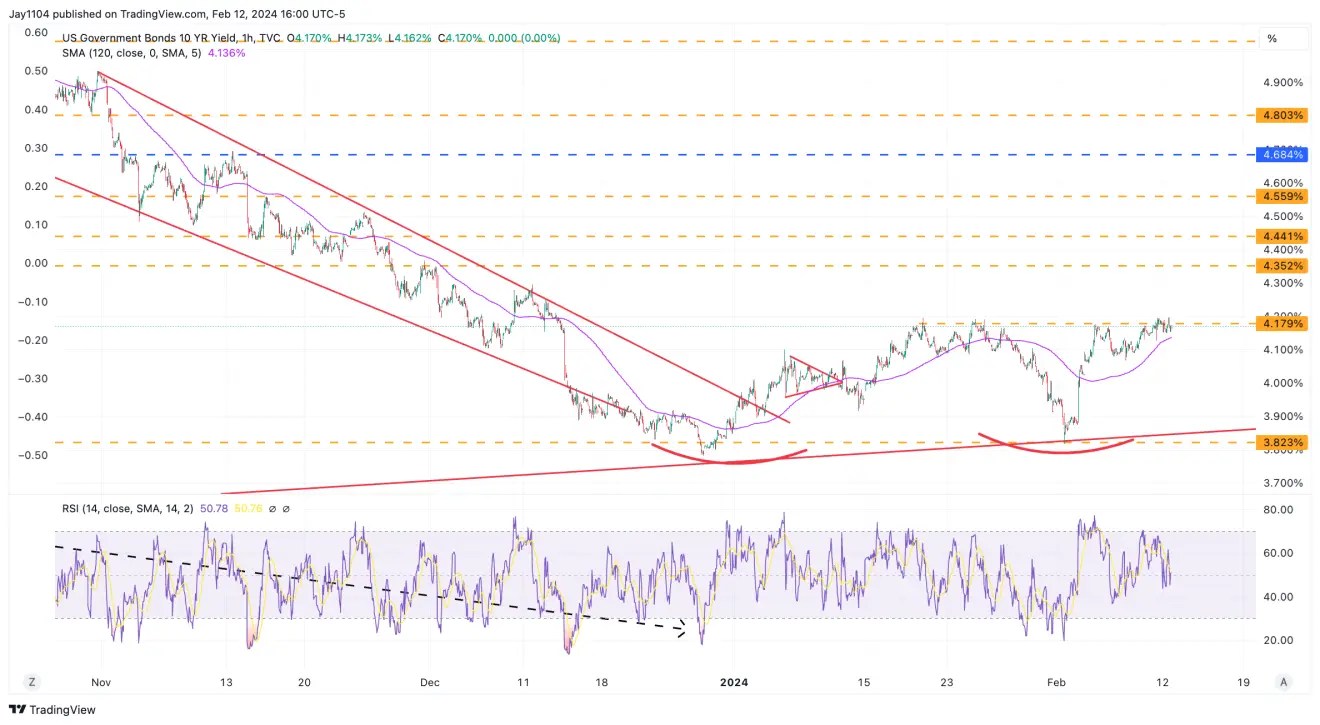 US 10-Year Govt Bonds-Hourly Chart
YouTube:
I will be back today with more.
Original Post
Source: Investing.com


