NDX
-0.02%
Add to/Remove from Watchlist
Add to Watchlist
Add Position
Position added successfully to:
Please name your holdings portfolio
Type:
BUY
SELL
Date:
Amount:
Price
Point Value:
Leverage:
1:1
1:10
1:25
1:50
1:100
1:200
1:400
1:500
1:1000
Commission:
Create New Watchlist
Create
Create a new holdings portfolio
Add
Create
+ Add another position
Close
USD/MXN
-0.16%
Add to/Remove from Watchlist
Add to Watchlist
Add Position
Position added successfully to:
Please name your holdings portfolio
Type:
BUY
SELL
Date:
Amount:
Price
Point Value:
Leverage:
1:1
1:10
1:25
1:50
1:100
1:200
1:400
1:500
1:1000
Commission:
Create New Watchlist
Create
Create a new holdings portfolio
Add
Create
+ Add another position
Close
US500
-0.38%
Add to/Remove from Watchlist
Add to Watchlist
Add Position
Position added successfully to:
Please name your holdings portfolio
Type:
BUY
SELL
Date:
Amount:
Price
Point Value:
Leverage:
1:1
1:10
1:25
1:50
1:100
1:200
1:400
1:500
1:1000
Commission:
Create New Watchlist
Create
Create a new holdings portfolio
Add
Create
+ Add another position
Close
NVDA
+0.35%
Add to/Remove from Watchlist
Add to Watchlist
Add Position
Position added successfully to:
Please name your holdings portfolio
Type:
BUY
SELL
Date:
Amount:
Price
Point Value:
Leverage:
1:1
1:10
1:25
1:50
1:100
1:200
1:400
1:500
1:1000
Commission:
Create New Watchlist
Create
Create a new holdings portfolio
Add
Create
+ Add another position
Close
DX
-0.13%
Add to/Remove from Watchlist
Add to Watchlist
Add Position
Position added successfully to:
Please name your holdings portfolio
Type:
BUY
SELL
Date:
Amount:
Price
Point Value:
Leverage:
1:1
1:10
1:25
1:50
1:100
1:200
1:400
1:500
1:1000
Commission:
Create New Watchlist
Create
Create a new holdings portfolio
Add
Create
+ Add another position
Close
US2YT=X
-0.57%
Add to/Remove from Watchlist
Add to Watchlist
Add Position
Position added successfully to:
Please name your holdings portfolio
Type:
BUY
SELL
Date:
Amount:
Price
Point Value:
Leverage:
1:1
1:10
1:25
1:50
1:100
1:200
1:400
1:500
1:1000
Commission:
Create New Watchlist
Create
Create a new holdings portfolio
Add
Create
+ Add another position
Close
US5YT=X
-0.67%
Add to/Remove from Watchlist
Add to Watchlist
Add Position
Position added successfully to:
Please name your holdings portfolio
Type:
BUY
SELL
Date:
Amount:
Price
Point Value:
Leverage:
1:1
1:10
1:25
1:50
1:100
1:200
1:400
1:500
1:1000
Commission:
Create New Watchlist
Create
Create a new holdings portfolio
Add
Create
+ Add another position
Close
US7YT=X
-0.61%
Add to/Remove from Watchlist
Add to Watchlist
Add Position
Position added successfully to:
Please name your holdings portfolio
Type:
BUY
SELL
Date:
Amount:
Price
Point Value:
Leverage:
1:1
1:10
1:25
1:50
1:100
1:200
1:400
1:500
1:1000
Commission:
Create New Watchlist
Create
Create a new holdings portfolio
Add
Create
+ Add another position
Close
US10Y…
-0.65%
Add to/Remove from Watchlist
Add to Watchlist
Add Position
Position added successfully to:
Please name your holdings portfolio
Type:
BUY
SELL
Date:
Amount:
Price
Point Value:
Leverage:
1:1
1:10
1:25
1:50
1:100
1:200
1:400
1:500
1:1000
Commission:
Create New Watchlist
Create
Create a new holdings portfolio
Add
Create
+ Add another position
Close
Stocks finished the day lower, with the S&P 500 dropping about 40 bps and the Nasdaq 100 finishing flat. Not much changed materially.
The Nasdaq has become my focal point in the last few days because it conveys an easier-to-understand message.
One that marks out support and resistance levels and remains below the 18,040 level that I noted yesterday, which is helping to define the 2b top.
If it is the case that this is the pattern, then a decline and the filling of the gap at 17,850 could occur.
I could easily argue that it could go even lower, but for that to happen, I would need rates to break above the 4.35% level on the 5, 7, and 10-year Treasuries.
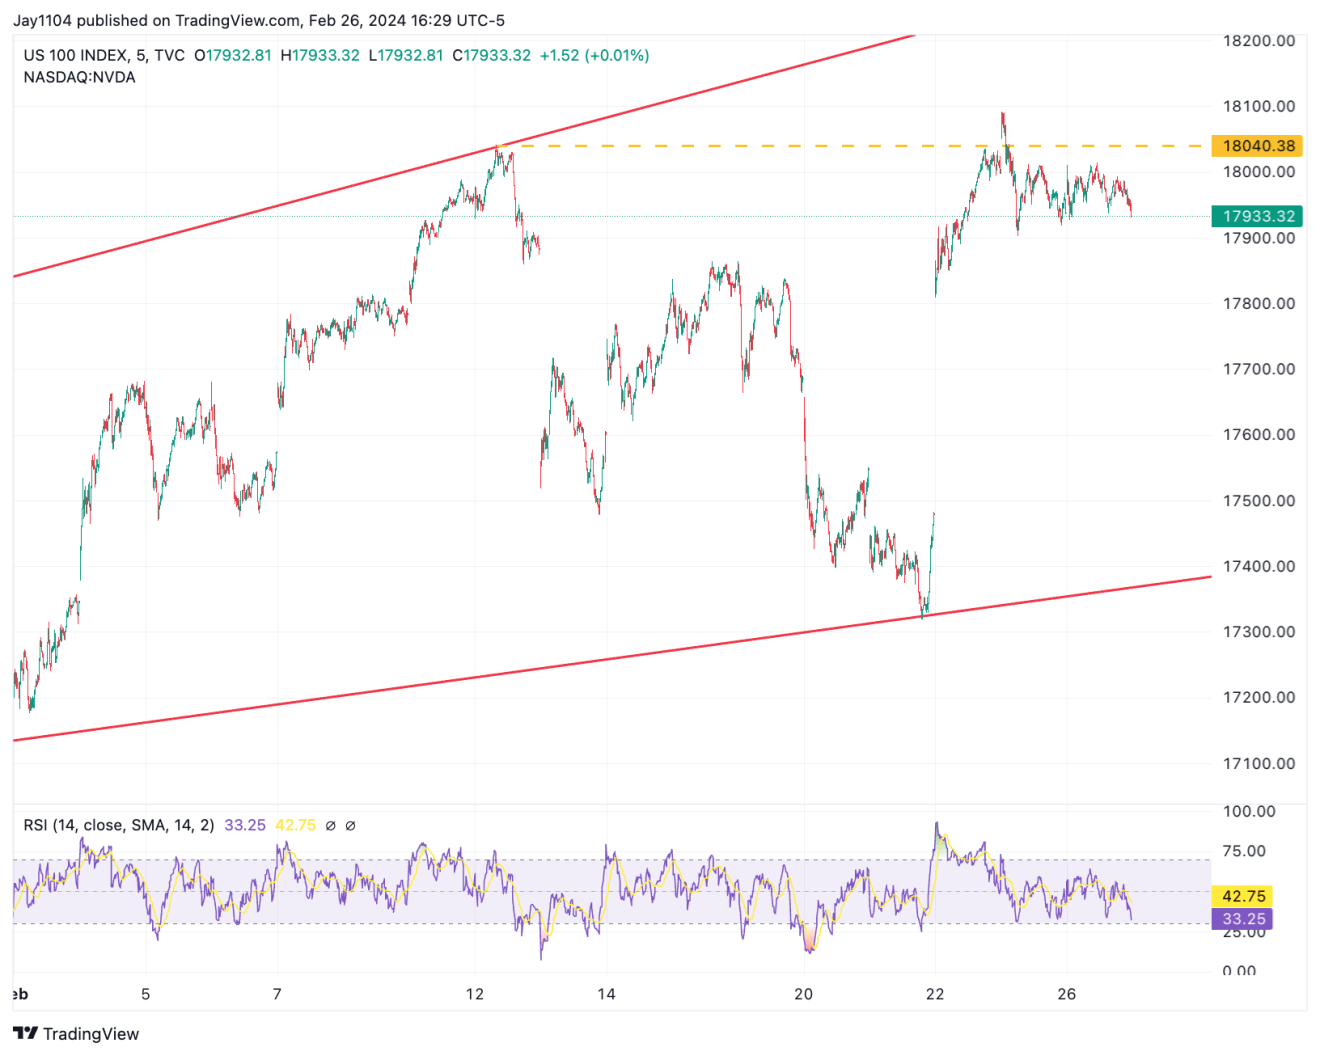 NDX-100 – 5-Minute Chart
Right now, that break higher in rates is not happening, which seems to be the key. The 2-year and 5-year auctions today, while not terrible, were not good either.
But neither was bad enough to see a big reaction in markets. That means that today’s attention will be turned to the 7-year Treasury and the PCE data on Thursday.
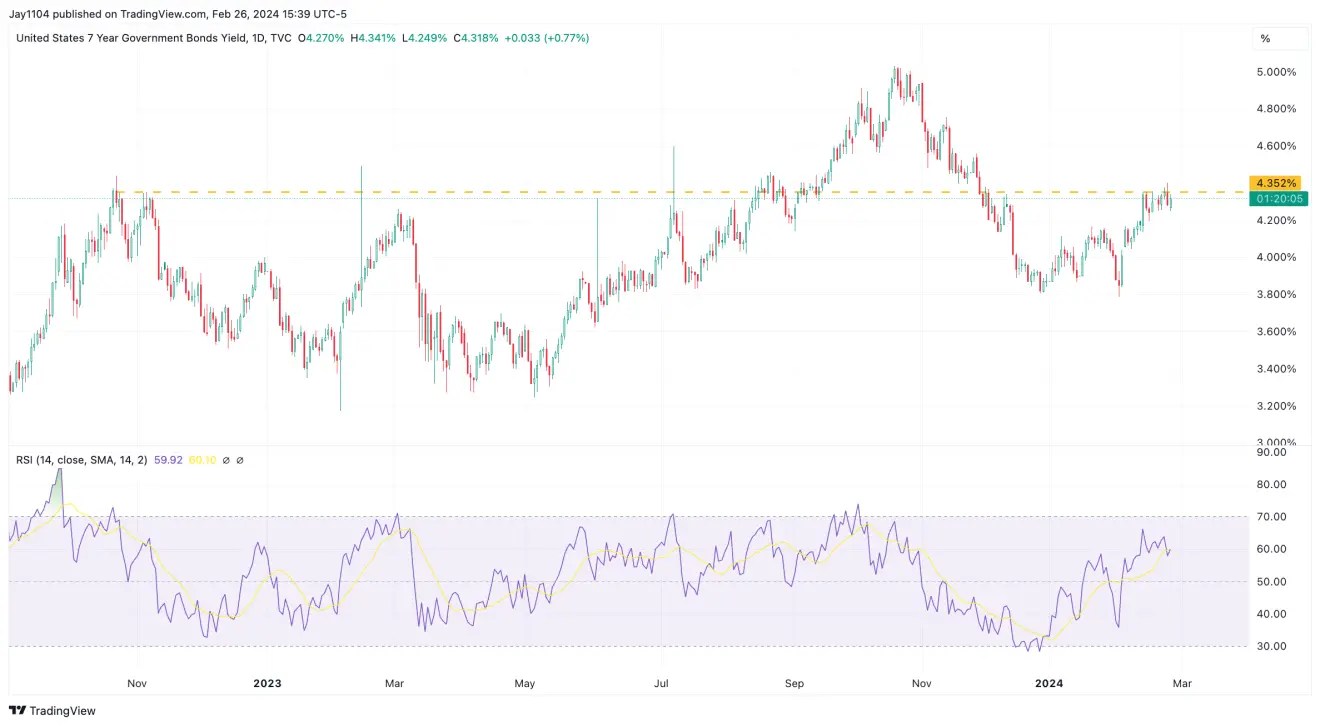 US 7-Year Government Bonds Yield-Daily Chart
You can also make the same case for the US dollar vs. the Mexican peso nearing a breakout, which has been moving along this downtrend since the beginning of February.
It seems like there is an opportunity for the peso to break out and push higher from current levels. It wouldn’t take much to get the peso moving higher.
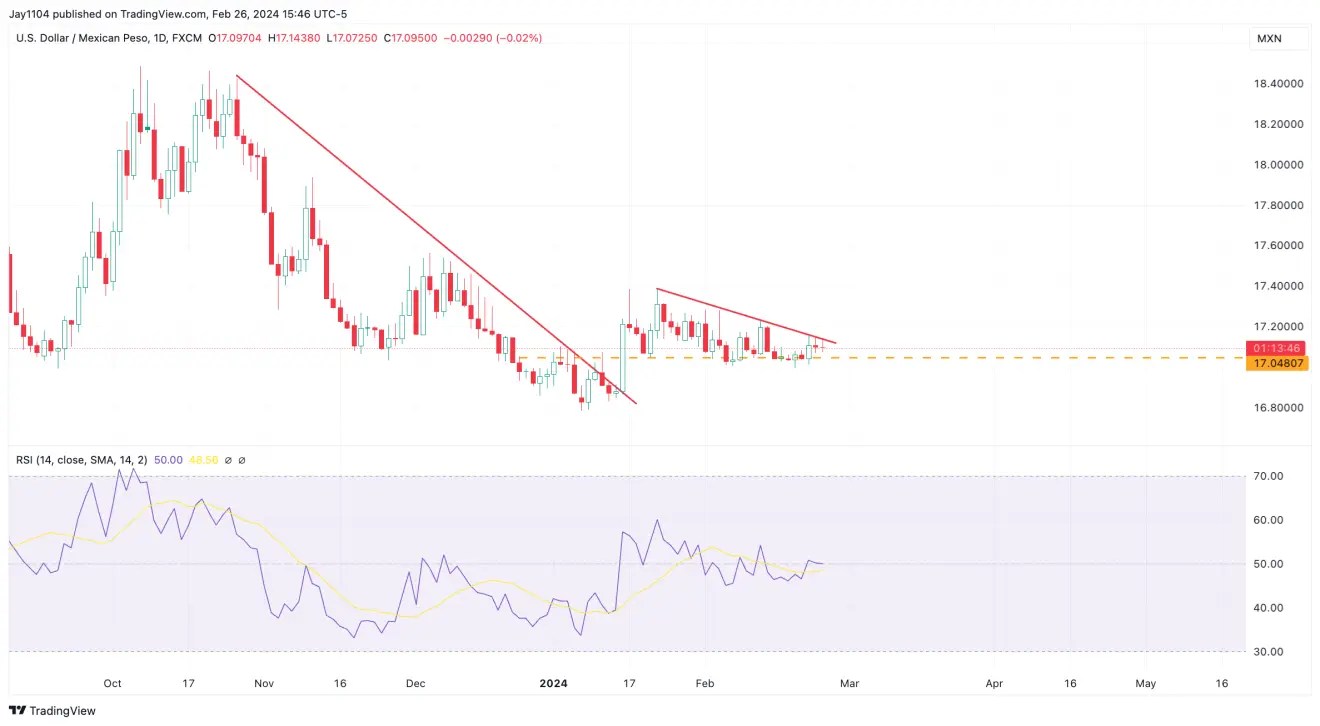 USD/MXN-Daily Chart
Meanwhile, Nvidia (Nasdaq:NVDA) continues to struggle with the $800 level, weaving above and below what has become a meaningful level of resistance.
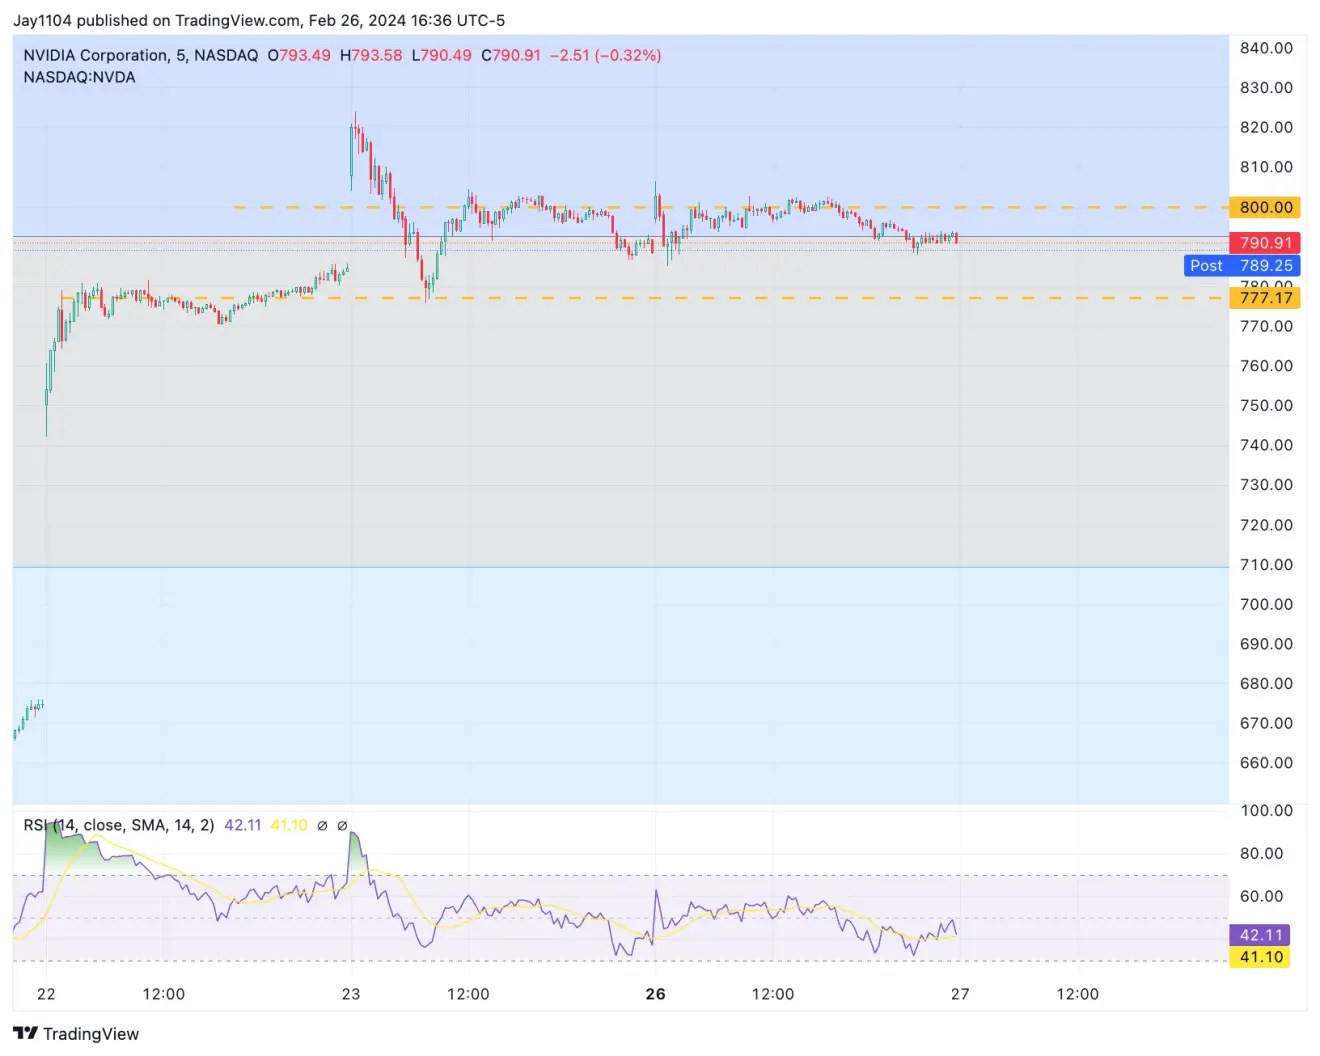 NVDA-5-Minute Chart
That is because there is a very large level of gamma at that $800 price, and until that clears or moves higher, then $800 is likely to remain a meaningful level of resistance.
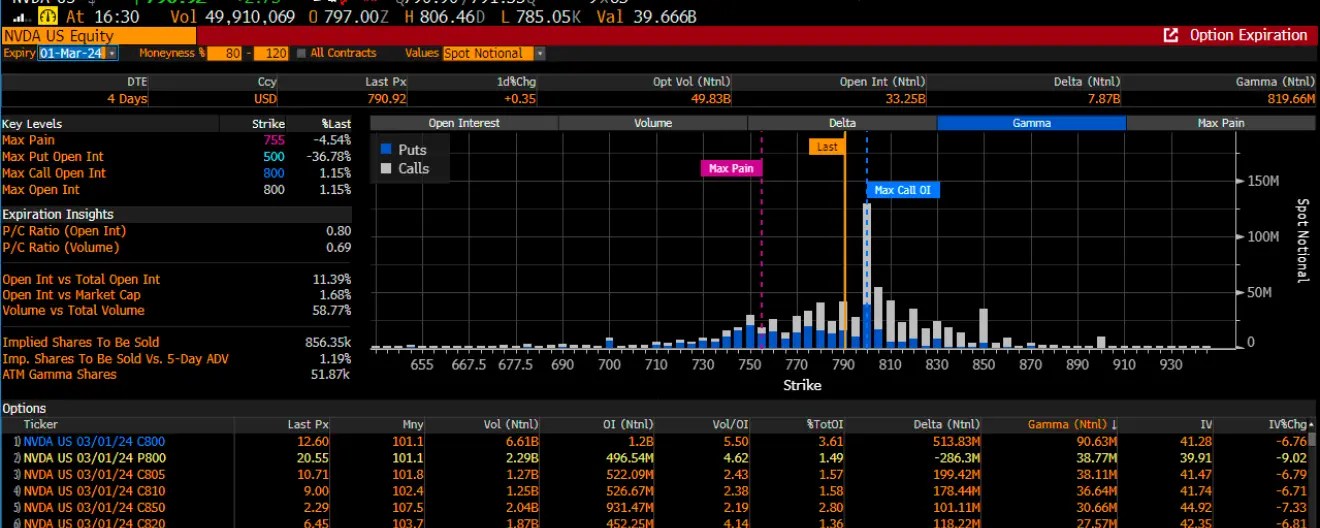 NVDA US Equity
So, at this point, given how much of the gains Nvidia has contributed to the market’s returns this year, if this stock has nothing left in the tank, then there isn’t likely to be much left in the tank for the entire market. So we will see what happens today.
Have a good one.
Original Post
Source: Investing.com


