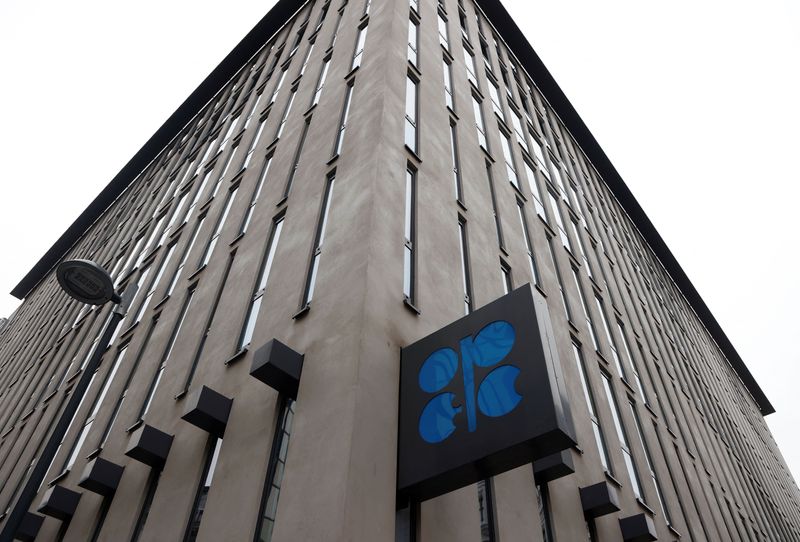
© Reuters. FILE PHOTO: A view of the logo of the Organization of the Petroleum Exporting Countries (OPEC) outside their headquarters in Vienna, Austria, November 30, 2023. REUTERS/Leonhard Foeger/File Photo
LONDON (Reuters) – The following table shows crude output by the Organization of the Petroleum Exporting Countries (OPEC) in millions of barrels per day (bpd) in February and January, according to a Reuters survey published on Thursday.
OPEC and allies, together known as OPEC+, announced a new round of voluntary cuts on Nov. 30 to be made in the first quarter of 2024. As part of this, Saudi Arabia extended its own 1 million bpd cut – first made in July 2023 – until the end of the first quarter.
The figures in the first and second columns of the table are in millions of barrels per day. Totals are rounded.
January output was not revised.
February January Change Q1target* Under/over
output output vs. Jan. target
Algeria 0.907 0.910 -3,000 908000 -1,000
Congo 0.260 0.270 -10,000 277,000 -17,000
Eq. Guinea 0.050 0.050 0 70,000 -20,000
Gabon 0.210 0.210 0 169,000 41,000
Iraq 4.120 4.150 -30,000 4,009,000 111,000
Kuwait 2.410 2.410 0 2,413,000 -3,000
Nigeria 1.600 1.540 60,000 1,500,000 100,000
Saudi Arabia 8.970 8.990 -20,000 8,978,000 -8,000
UAE 2.900 2.920 -20,000 2,912,000 -12,000
TOTAL OPEC 9 21.427 21.450 -23,000 21,236,000 191,000
Iran 3.050 3.100 -50,000
Libya 1.150 1.000 150,000
Venezuela 0.790 0.780 10,000
TOTAL OPEC 12 26.417 26.330 87,000
* Output target as announced by the countries making voluntary cuts, or as announced by OPEC
Iran, Libya and Venezuela are exempt from OPEC output agreements.
The Reuters survey aims to assess crude supply to market, defined to exclude movements to, but not sales from, storage. Saudi and Kuwaiti data includes the Neutral Zone.
Venezuelan data includes upgraded synthetic oil. Nigerian crude output includes the Agbami and Egina streams and excludes Akpo condensate.
Source: Investing.com


