US500
+0.80%
Add to/Remove from Watchlist
Add to Watchlist
Add Position
Position added successfully to:
Please name your holdings portfolio
Type:
BUY
SELL
Date:
Amount:
Price
Point Value:
Leverage:
1:1
1:10
1:25
1:50
1:100
1:200
1:400
1:500
1:1000
Commission:
Create New Watchlist
Create
Create a new holdings portfolio
Add
Create
+ Add another position
Close
US2000
+1.05%
Add to/Remove from Watchlist
Add to Watchlist
Add Position
Position added successfully to:
Please name your holdings portfolio
Type:
BUY
SELL
Date:
Amount:
Price
Point Value:
Leverage:
1:1
1:10
1:25
1:50
1:100
1:200
1:400
1:500
1:1000
Commission:
Create New Watchlist
Create
Create a new holdings portfolio
Add
Create
+ Add another position
Close
IWM
+1.06%
Add to/Remove from Watchlist
Add to Watchlist
Add Position
Position added successfully to:
Please name your holdings portfolio
Type:
BUY
SELL
Date:
Amount:
Price
Point Value:
Leverage:
1:1
1:10
1:25
1:50
1:100
1:200
1:400
1:500
1:1000
Commission:
Create New Watchlist
Create
Create a new holdings portfolio
Add
Create
+ Add another position
Close
IXIC
+1.14%
Add to/Remove from Watchlist
Add to Watchlist
Add Position
Position added successfully to:
Please name your holdings portfolio
Type:
BUY
SELL
Date:
Amount:
Price
Point Value:
Leverage:
1:1
1:10
1:25
1:50
1:100
1:200
1:400
1:500
1:1000
Commission:
Create New Watchlist
Create
Create a new holdings portfolio
Add
Create
+ Add another position
Close
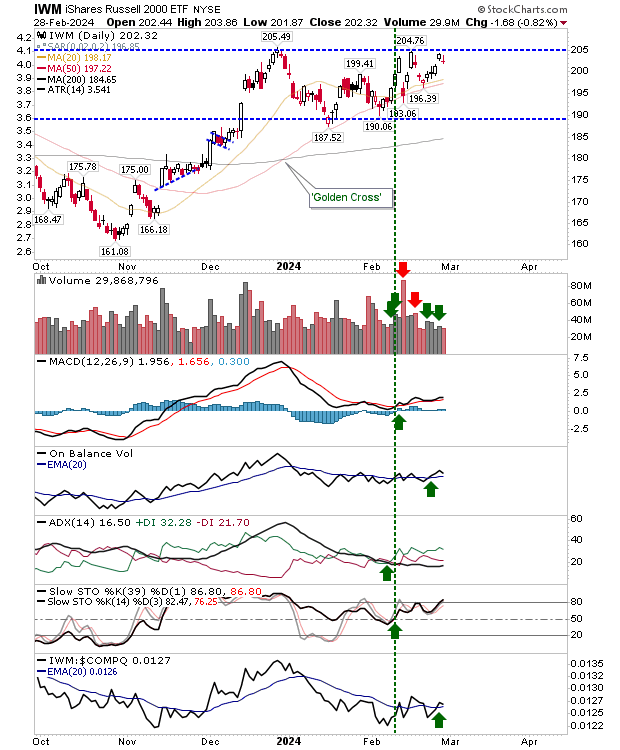
Up to now, the Russell 2000 IWM had been doing most of the running, marked by the relative performance gains of this index against the S&P 500 and Nasdaq, but yesterday was the first stall in this rally.
Technicals for the Russell 2000 are net positive and remain so despite yesterday’s loss. The index is well set up for a breakout next week – I wouldn’t be too concerned with yesterday’s action.
 IWM-Daily Chart
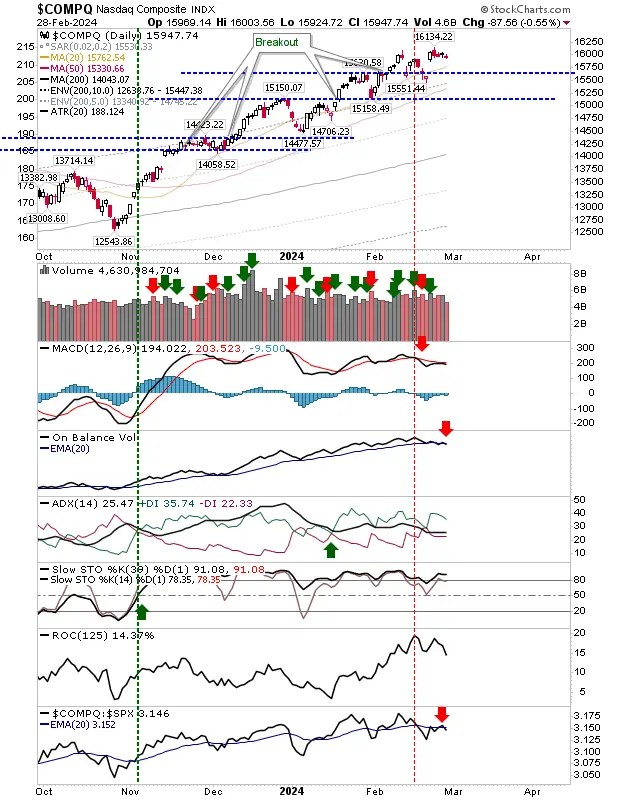
The Nasdaq is defending the substantial breakout gap from last week and will soon have the 20-day MA to lean on as part of this defense.
There are active ‘sell’ triggers in the MACD and On-Balance-Volume to work off, but other technicals are positive.
 COMPQ-Daily Chart
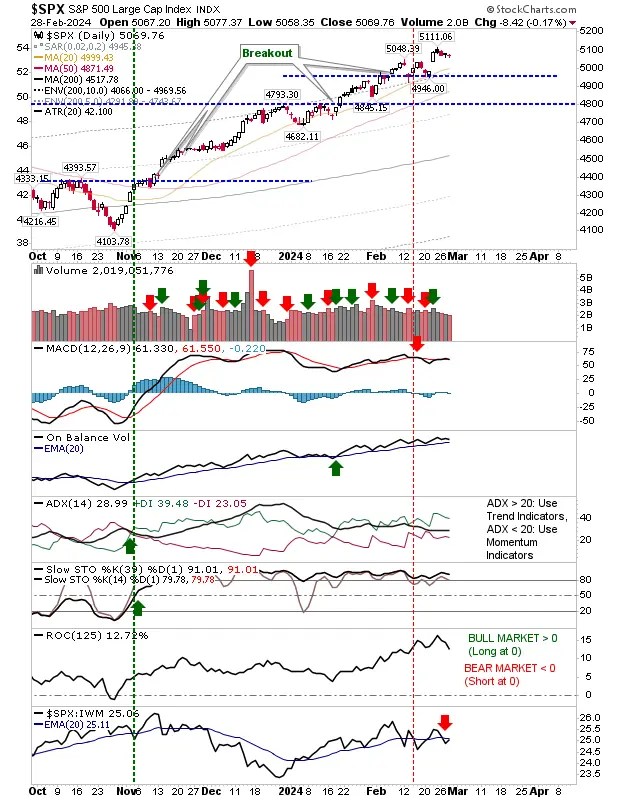
The S&P 500 also has a breakout gap to defend with a similar technical picture as the Nasdaq, although On-Balance-Volume is still on a ‘buy’ trigger.
And as with the Nasdaq, I will be looking to the 20-day MA to play an active supporting role.
 SPX-Daily Chart
There isn’t a whole lot to add, other than markets remain near all-time highs and it will only take one good day to consume the losses of the last few days.
Source: Investing.com


