NDX
+1.44%
Add to/Remove from Watchlist
Add to Watchlist
Add Position
Position added successfully to:
Please name your holdings portfolio
Type:
BUY
SELL
Date:
Amount:
Price
Point Value:
Leverage:
1:1
1:10
1:25
1:50
1:100
1:200
1:400
1:500
1:1000
Commission:
Create New Watchlist
Create
Create a new holdings portfolio
Add
Create
+ Add another position
Close
USD/CAD
+0.04%
Add to/Remove from Watchlist
Add to Watchlist
Add Position
Position added successfully to:
Please name your holdings portfolio
Type:
BUY
SELL
Date:
Amount:
Price
Point Value:
Leverage:
1:1
1:10
1:25
1:50
1:100
1:200
1:400
1:500
1:1000
Commission:
Create New Watchlist
Create
Create a new holdings portfolio
Add
Create
+ Add another position
Close
AAPL
-0.60%
Add to/Remove from Watchlist
Add to Watchlist
Add Position
Position added successfully to:
Please name your holdings portfolio
Type:
BUY
SELL
Date:
Amount:
Price
Point Value:
Leverage:
1:1
1:10
1:25
1:50
1:100
1:200
1:400
1:500
1:1000
Commission:
Create New Watchlist
Create
Create a new holdings portfolio
Add
Create
+ Add another position
Close
DX
-0.04%
Add to/Remove from Watchlist
Add to Watchlist
Add Position
Position added successfully to:
Please name your holdings portfolio
Type:
BUY
SELL
Date:
Amount:
Price
Point Value:
Leverage:
1:1
1:10
1:25
1:50
1:100
1:200
1:400
1:500
1:1000
Commission:
Create New Watchlist
Create
Create a new holdings portfolio
Add
Create
+ Add another position
Close
AVGO
+7.59%
Add to/Remove from Watchlist
Add to Watchlist
Add Position
Position added successfully to:
Please name your holdings portfolio
Type:
BUY
SELL
Date:
Amount:
Price
Point Value:
Leverage:
1:1
1:10
1:25
1:50
1:100
1:200
1:400
1:500
1:1000
Commission:
Create New Watchlist
Create
Create a new holdings portfolio
Add
Create
+ Add another position
Close
TSLA
+0.38%
Add to/Remove from Watchlist
Add to Watchlist
Add Position
Position added successfully to:
Please name your holdings portfolio
Type:
BUY
SELL
Date:
Amount:
Price
Point Value:
Leverage:
1:1
1:10
1:25
1:50
1:100
1:200
1:400
1:500
1:1000
Commission:
Create New Watchlist
Create
Create a new holdings portfolio
Add
Create
+ Add another position
Close
XLK
+1.83%
Add to/Remove from Watchlist
Add to Watchlist
Add Position
Position added successfully to:
Please name your holdings portfolio
Type:
BUY
SELL
Date:
Amount:
Price
Point Value:
Leverage:
1:1
1:10
1:25
1:50
1:100
1:200
1:400
1:500
1:1000
Commission:
Create New Watchlist
Create
Create a new holdings portfolio
Add
Create
+ Add another position
Close
A lot is happening this week with key data and earnings in the offing. Powell, the ECB, and Broadcom (NASDAQ:AVGO) earnings have the potential to be market movers.
As discussed on Thursday, the Nasdaq 100 was able to gap higher on Friday, move above resistance at its Bollinger band, and appears to be heading towards the upper trend line of the rising broadening wedge, which comes around 18,450.
We will have to see what happens once we arrive there. That will be the third touching point in the pattern on the uptrend line, and it means either the pattern breaks out and the advance continues or it will mark a turning point where the index heads back to 17,450.
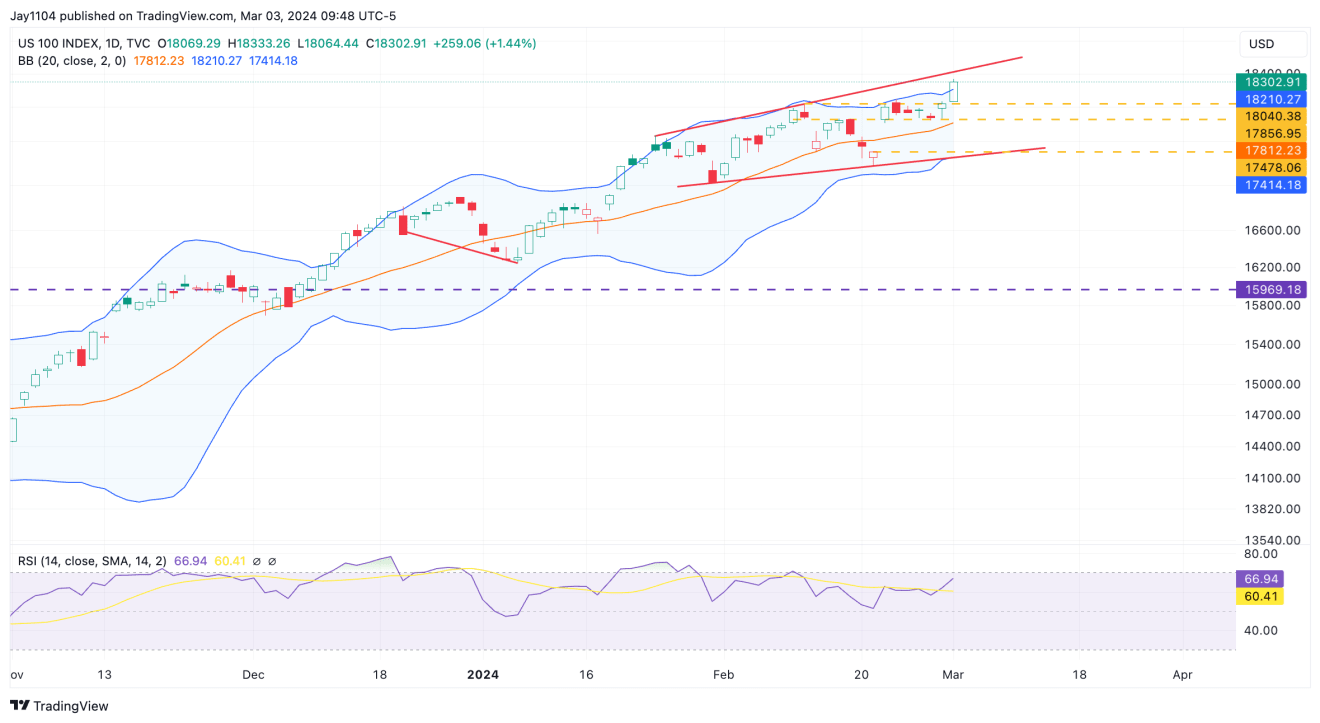 Nasdaq 100-Daily Chart
The XLK has a similar pattern, and it hit resistance on Friday.
So, the ETF needs to gap higher on Monday, and resistance needs to be taken out. Otherwise, it seems obvious that we would like to reverse at some point and start the process of filling the gap at $199.
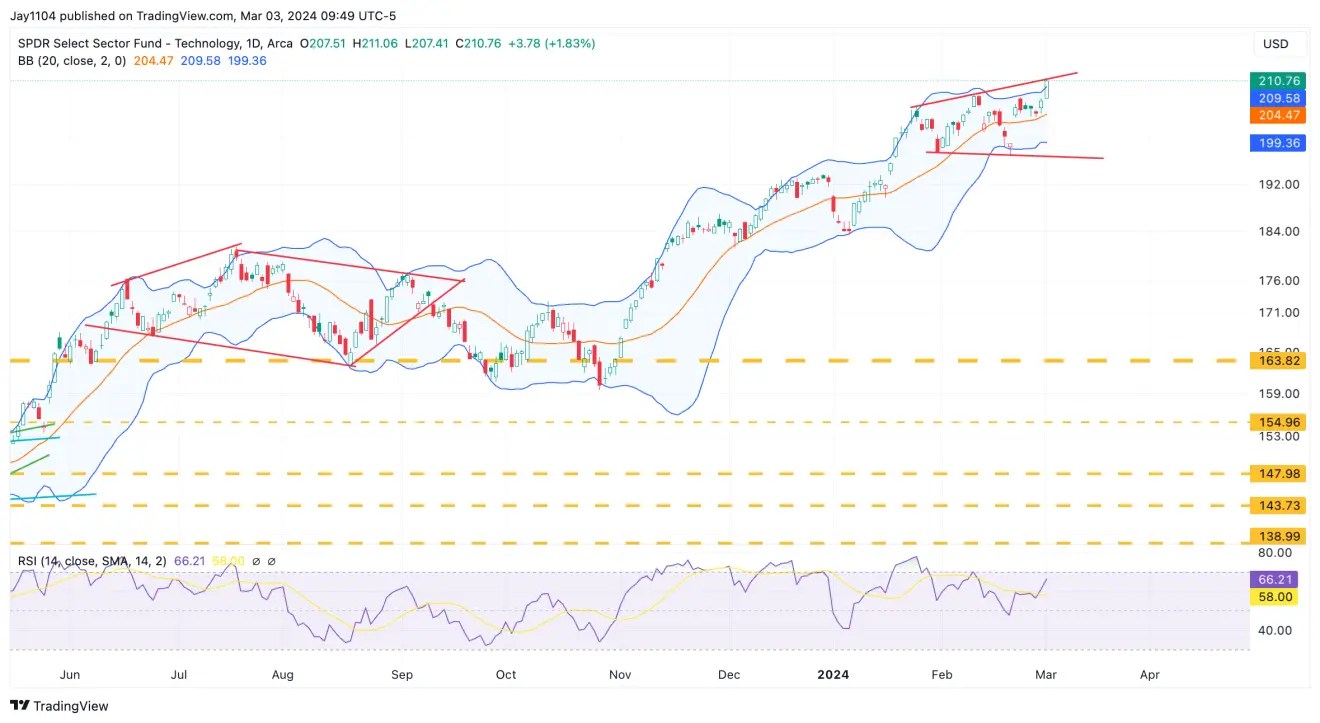 XLK-Daily Chart
Broadcom Climbs Ahead of Earnings
We used to care about Broadcom because it was a signal to Apple (NASDAQ:AAPL) and the other Apple suppliers. Now Broadcom has seen its Market Cap rise to $650 billion, and surpass Tesla (NASDAQ:TSLA). Yeah.
Seeing what Broadcom says when they report on Thursday after the close will be interesting. The company is expected to see fiscal first quarter 2024 earnings climb by 85 bps, yes 0.85%, as in
For the second quarter, the company is expected to see earnings grow by 8.8% to $11.22 per share, with revenue growth of 37.1% to $11.9 billion. The growth isn’t driven by the chip side (AI) of the business, because semiconductor solutions is growing by 8.3% to $7.7 billion this quarter, and by 12.7% next quarter to $7.7 billion.
The growth comes from their software business, rising by 124.6% to $4.0 billion and 140.1% next quarter to $4.6 billion. Remember this is a company that bought the old Computer Associates years ago and has made other questionable acquisitions to try and diversify its chip business and increase margins. Additionally, they just recently completed a purchase of VMware (NYSE:VMW), which is driving much of the year-over-year revenue growth.
If they were smart, they would take the recent run-up in the stock and do a secondary offering to pay off the $58 billion in debt it is expected to have, and say thank you for the AI hype the market has awarded the stock, rightly or wrongly.
Hock Tan is a smart guy, but I think he would be even brighter if he did a secondary offering, and for less than 10% of the company’s value wiped out all its debt. The option holders may not like it, but that is not his problem.
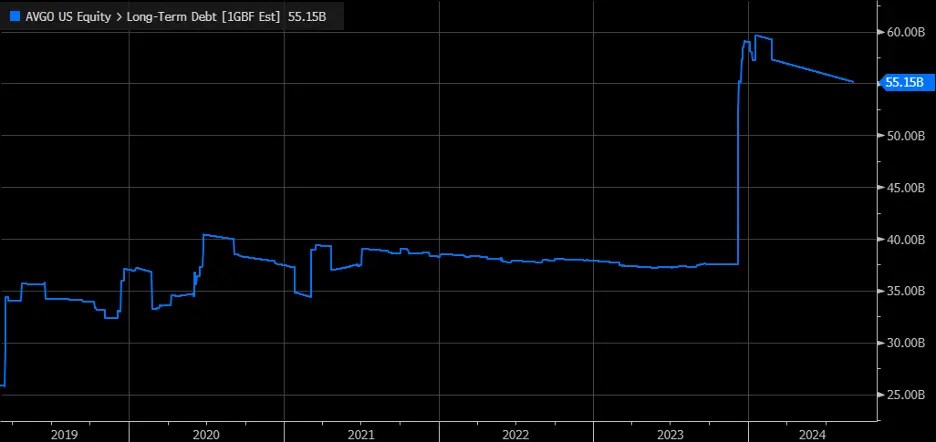 AVGO-Long-Term Debt
Spreads Continue to Ease
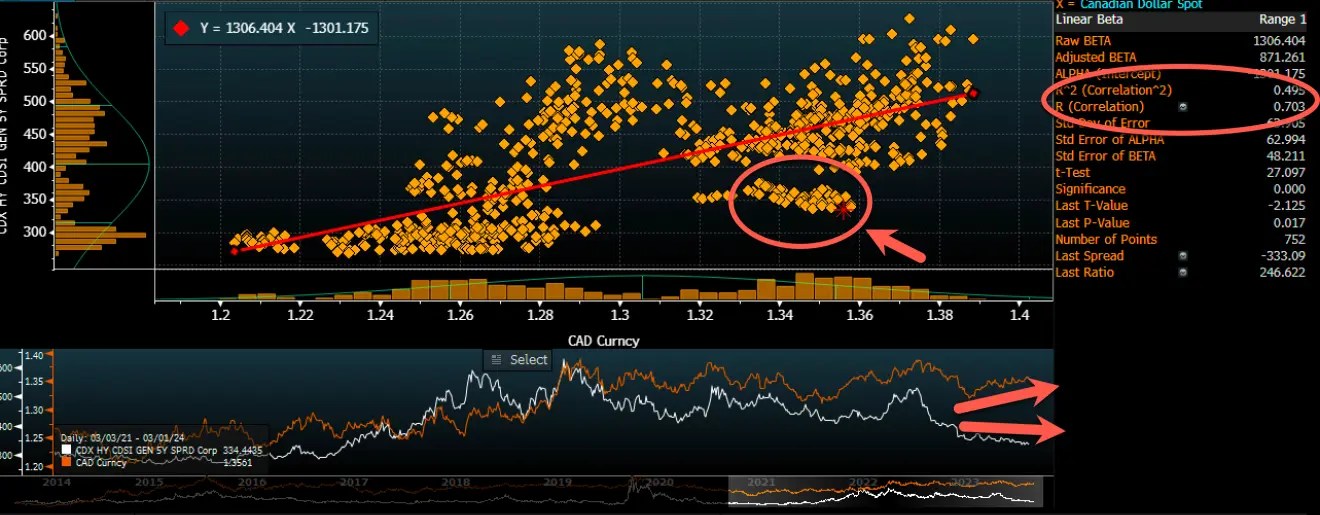
Meanwhile, credit spreads continue to ease, and that is also helping to keep these equity markets lifted. The odd part is that given where the dollar is; credit spreads seem historically lower since 2021.
The data shows a correlation of 0.70 with an R^2 of 0.50 between the USD/CAD and the CDX HY Index, both solid numbers, and yet, we are out on an island at this point, but with both the CDX high yield index moving lower, as the USD/CAD moves higher, implying dollar strength. Based on this I would have thought that credit spreads would be around 400 to 450. But it is just not happening, and I do not know why.
 Credit Spreads
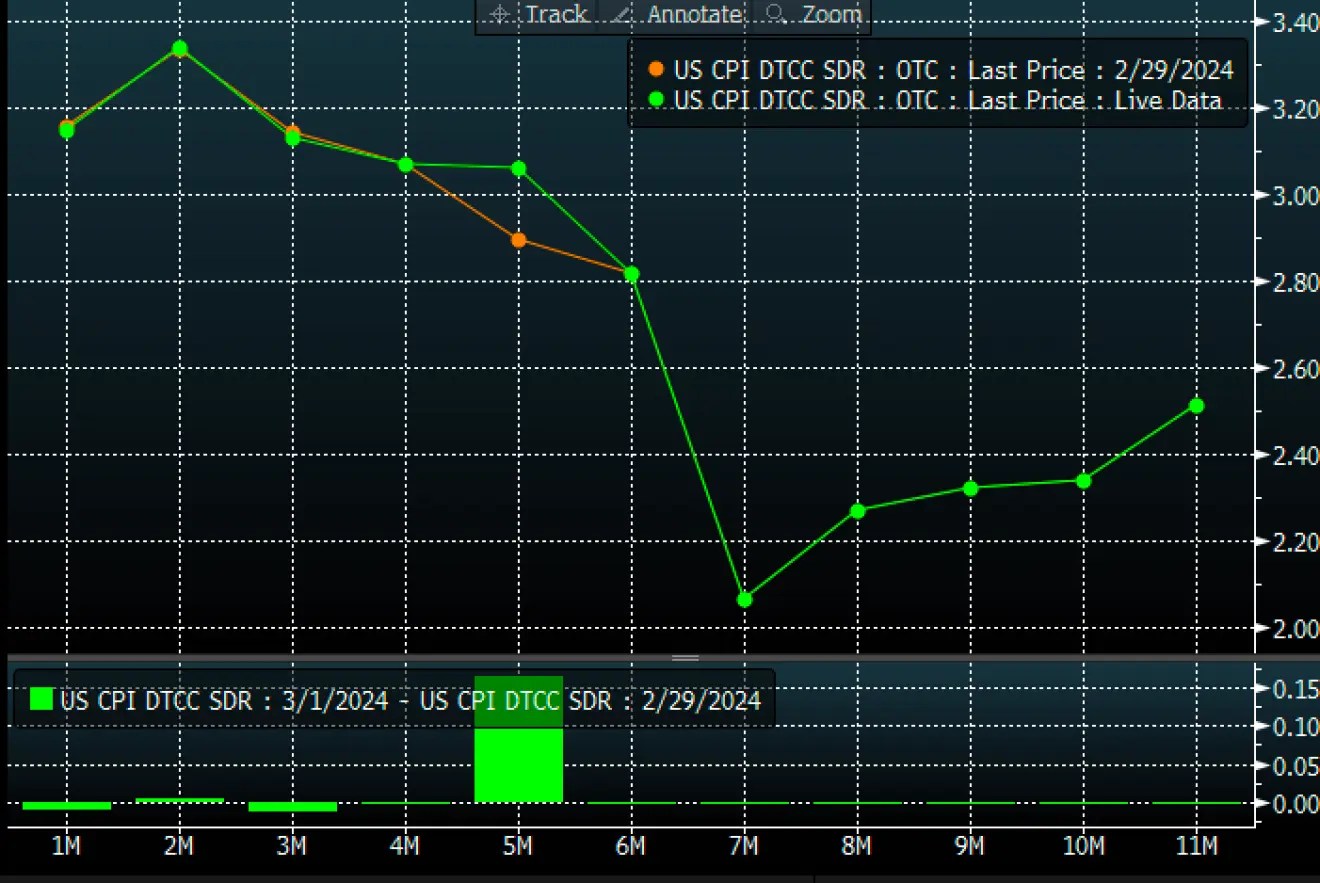
Finally, CPI swaps are pricing a 3% y/y inflation rate through June. That was where the inflation was in June 2023, so much for the progress.
 US CPI Data
Anyway, enjoy today, the rest of the week gets increasingly more busy.
Original Post
Source: Investing.com


