US500
-0.12%
Add to/Remove from Watchlist
Add to Watchlist
Add Position
Position added successfully to:
Please name your holdings portfolio
Type:
BUY
SELL
Date:
Amount:
Price
Point Value:
Leverage:
1:1
1:10
1:25
1:50
1:100
1:200
1:400
1:500
1:1000
Commission:
Create New Watchlist
Create
Create a new holdings portfolio
Add
Create
+ Add another position
Close
GOOGL
-2.76%
Add to/Remove from Watchlist
Add to Watchlist
Add Position
Position added successfully to:
Please name your holdings portfolio
Type:
BUY
SELL
Date:
Amount:
Price
Point Value:
Leverage:
1:1
1:10
1:25
1:50
1:100
1:200
1:400
1:500
1:1000
Commission:
Create New Watchlist
Create
Create a new holdings portfolio
Add
Create
+ Add another position
Close
AAPL
-2.54%
Add to/Remove from Watchlist
Add to Watchlist
Add Position
Position added successfully to:
Please name your holdings portfolio
Type:
BUY
SELL
Date:
Amount:
Price
Point Value:
Leverage:
1:1
1:10
1:25
1:50
1:100
1:200
1:400
1:500
1:1000
Commission:
Create New Watchlist
Create
Create a new holdings portfolio
Add
Create
+ Add another position
Close
NVDA
+3.60%
Add to/Remove from Watchlist
Add to Watchlist
Add Position
Position added successfully to:
Please name your holdings portfolio
Type:
BUY
SELL
Date:
Amount:
Price
Point Value:
Leverage:
1:1
1:10
1:25
1:50
1:100
1:200
1:400
1:500
1:1000
Commission:
Create New Watchlist
Create
Create a new holdings portfolio
Add
Create
+ Add another position
Close
TSLA
-7.16%
Add to/Remove from Watchlist
Add to Watchlist
Add Position
Position added successfully to:
Please name your holdings portfolio
Type:
BUY
SELL
Date:
Amount:
Price
Point Value:
Leverage:
1:1
1:10
1:25
1:50
1:100
1:200
1:400
1:500
1:1000
Commission:
Create New Watchlist
Create
Create a new holdings portfolio
Add
Create
+ Add another position
Close
XLK
0.00%
Add to/Remove from Watchlist
Add to Watchlist
Add Position
Position added successfully to:
Please name your holdings portfolio
Type:
BUY
SELL
Date:
Amount:
Price
Point Value:
Leverage:
1:1
1:10
1:25
1:50
1:100
1:200
1:400
1:500
1:1000
Commission:
Create New Watchlist
Create
Create a new holdings portfolio
Add
Create
+ Add another position
Close
GOOG
-2.81%
Add to/Remove from Watchlist
Add to Watchlist
Add Position
Position added successfully to:
Please name your holdings portfolio
Type:
BUY
SELL
Date:
Amount:
Price
Point Value:
Leverage:
1:1
1:10
1:25
1:50
1:100
1:200
1:400
1:500
1:1000
Commission:
Create New Watchlist
Create
Create a new holdings portfolio
Add
Create
+ Add another position
Close
The S&P 500 finished lower yesterday, dropping by around ten bps and led lower by Apple (NASDAQ:AAPL), Tesla (NASDAQ:TSLA), and Alphabet (NASDAQ:GOOGL).
Yes, they all fell by 2% or more, and the only reason why the index was down ten bps was that Nvidia (NASDAQ:NVDA) was up 3.6% and offset all of Apple’s declines.
 SPX Index TableBloomberg
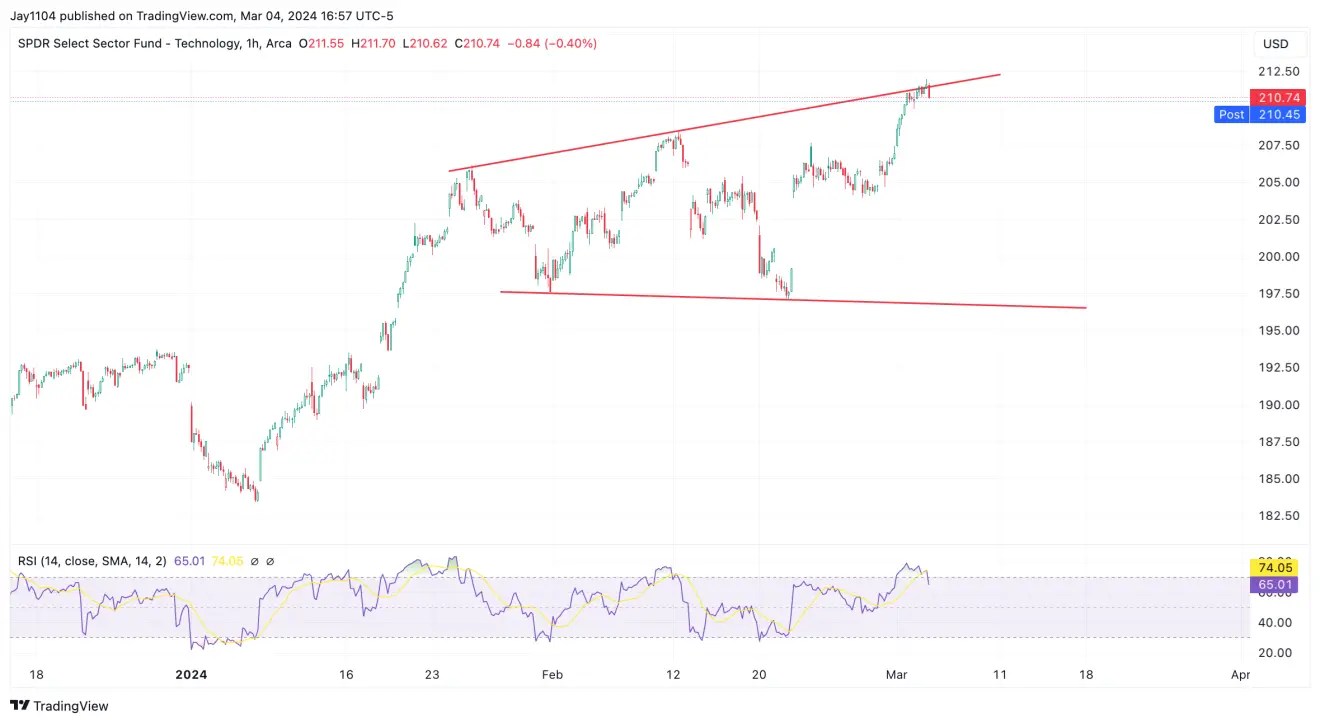
The XLK was flat yesterday, and we can see that the XLK was not able to advance beyond the upper trend line in the broadening wedge pattern.
It will be interesting to see if the XLK moves lower today and heads toward the lower trend line of the wedge and the giant gap at $199.
 XLK-1-Hour Chart
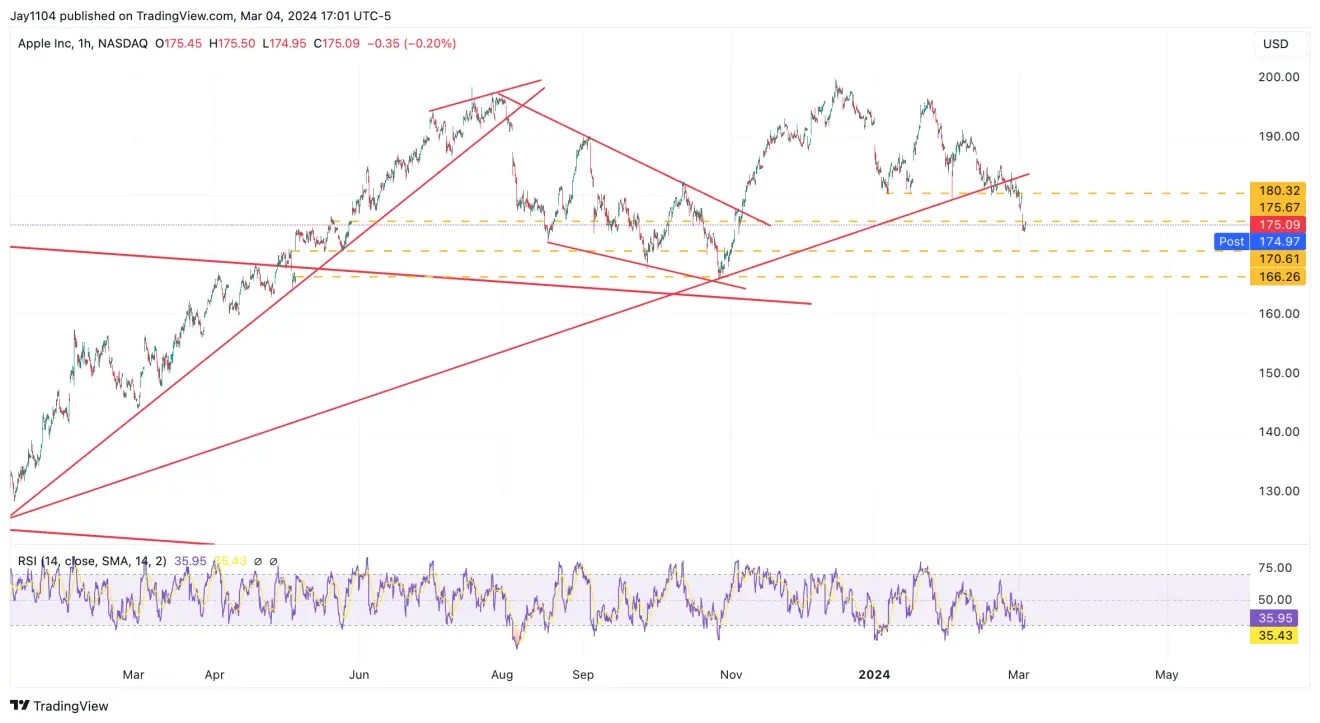
Meanwhile, one reason the XLK may continue lower is Apple, which fell by 2.5% yesterday and is now at its lowest point since November.
There’s certainly a technical case for Apple to go lower at this point, and perhaps a fundamental one, given the weakness of iPhone sales in China in recent quarters, and less than stellar results.
A return to $166 doesn’t seem impossible, given that the stock has broken support at $180.
 Apple Inc-1-Hour Chart
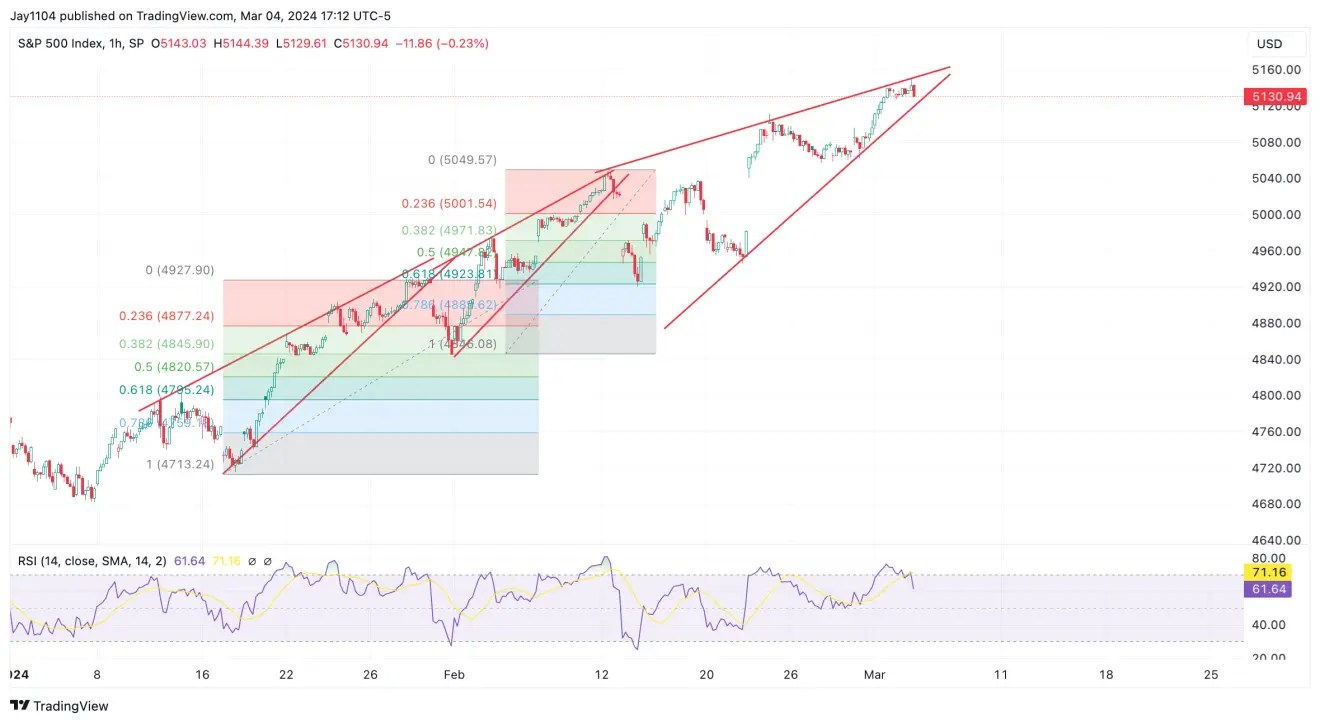
Meanwhile, another rising wedge formed in the S&P 500. This one seems bigger and broader than the one last seen in mid-January and again in mid-February, both of which retraced 50% and 61.8% of their respective moves higher.
So, we will see how the market treats this pattern. There have been three clear touches of the upper trend line and just two on the lower trendline, so if the index gaps lower today, and below 5,125, then the rising wedge is broken, and lower prices and that potential gap fill at 4,950 may be on its way.
 SPX Index-1-Hour Chart
We will see what happens today. today, ISM services data will be available at 10 AM.
Original Post
Source: Investing.com


