US500
-0.11%
Add to/Remove from Watchlist
Add to Watchlist
Add Position
Position added successfully to:
Please name your holdings portfolio
Type:
BUY
SELL
Date:
Amount:
Price
Point Value:
Leverage:
1:1
1:10
1:25
1:50
1:100
1:200
1:400
1:500
1:1000
Commission:
Create New Watchlist
Create
Create a new holdings portfolio
Add
Create
+ Add another position
Close
US2000
-0.81%
Add to/Remove from Watchlist
Add to Watchlist
Add Position
Position added successfully to:
Please name your holdings portfolio
Type:
BUY
SELL
Date:
Amount:
Price
Point Value:
Leverage:
1:1
1:10
1:25
1:50
1:100
1:200
1:400
1:500
1:1000
Commission:
Create New Watchlist
Create
Create a new holdings portfolio
Add
Create
+ Add another position
Close
IWM
-0.79%
Add to/Remove from Watchlist
Add to Watchlist
Add Position
Position added successfully to:
Please name your holdings portfolio
Type:
BUY
SELL
Date:
Amount:
Price
Point Value:
Leverage:
1:1
1:10
1:25
1:50
1:100
1:200
1:400
1:500
1:1000
Commission:
Create New Watchlist
Create
Create a new holdings portfolio
Add
Create
+ Add another position
Close
IXIC
-0.41%
Add to/Remove from Watchlist
Add to Watchlist
Add Position
Position added successfully to:
Please name your holdings portfolio
Type:
BUY
SELL
Date:
Amount:
Price
Point Value:
Leverage:
1:1
1:10
1:25
1:50
1:100
1:200
1:400
1:500
1:1000
Commission:
Create New Watchlist
Create
Create a new holdings portfolio
Add
Create
+ Add another position
Close
Markets were set up for a sizable down day, or at least one to undercut breakout support, but this didn’t happen. While there was no real change on the day the fact that there were no major losses should be viewed as a positive.
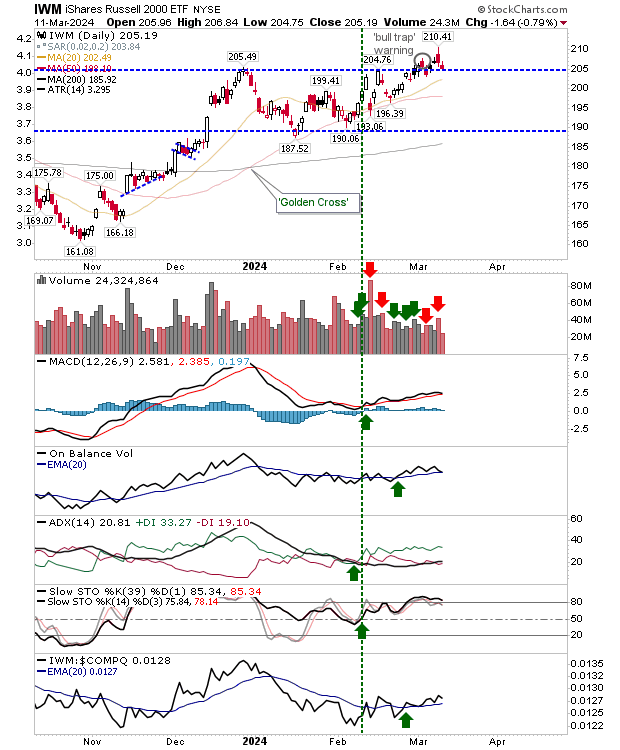
The Russell 2000 (IWM) finished right on $205 support with no technical change.
The index is still outperforming the Nasdaq and the S&P 500. I’m watching for an intraday spike down to the 20-day MA, but would expect a close above $205 to maintain the story for a successful breakout.
 IWM-Daily Chart
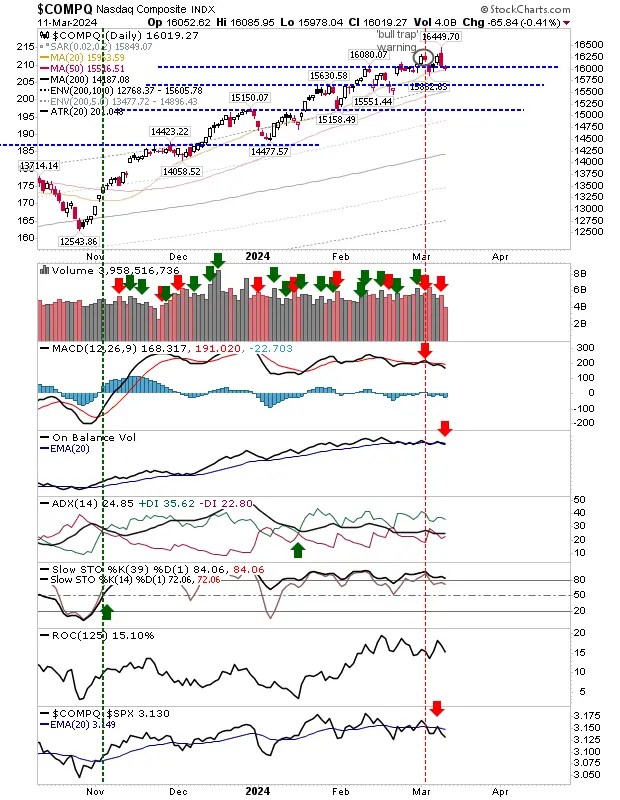
The Nasdaq also finished above psychological (and breakout) support of 16K with the 20-day just below this key support level.
Yesterday’s volume didn’t rank as distribution, but it was enough to see a new ‘sell’ trigger in On-Balance-Volume – although this particular indicator has been in flatlined/whipsaw territory since the end of February.
 COMPQ-Daily Chart
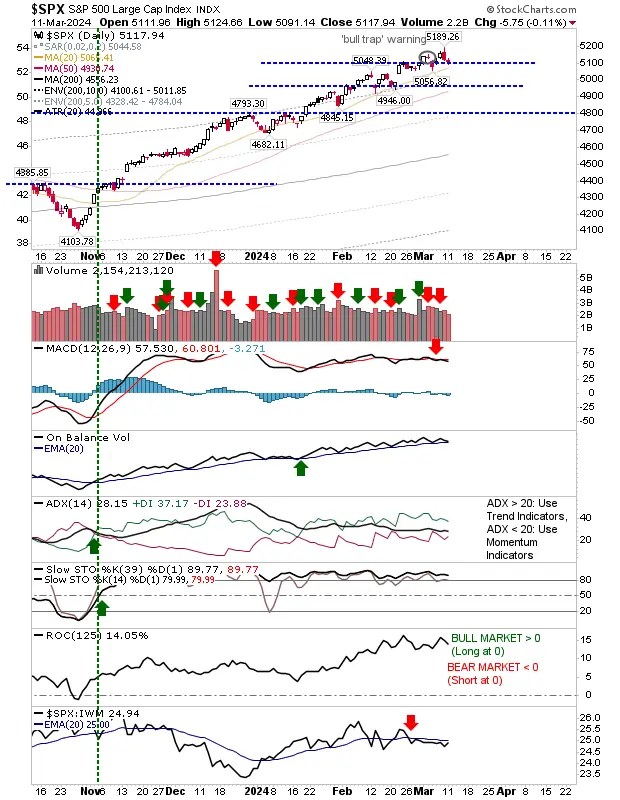
The S&P 500 finished just above breakout support near 5,100 but without the ‘sell’ trigger in On-Balance-Volume. Again, I still think an intraday move to the 20-day MA would seem more likely, but a straight bounce off support can’t be ruled out.
 SPX-Daily Chart
Heading into today, watch for early losses in the first 30-60 minutes, and then buyers step in to bring things back above breakout support.
Source: Investing.com


