April 13, 2016 Updated 4/13/2016
Email Print
Bill Wood

It’s no secret that both the U.S. economy and the U.S. manufacturing sector got off to a sluggish start in 2016. The inflation-adjusted GDP data for the first quarter (to be released later this month) is expected to post a growth rate of less than 1 percent.
This rate of growth is a deceleration from the less-than-stellar gain of 1.4 percent registered in the fourth quarter of 2015. So we are still growing, but we could use a little more speed here.
Fortunately, the most recent data indicate that activity levels for many sectors of the economy, especially manufacturing, perked up in March. Each month, the Institute of Supply Management conducts a survey across a broad swath of American manufacturers that asks about current activity levels, and the results from last month are encouraging.
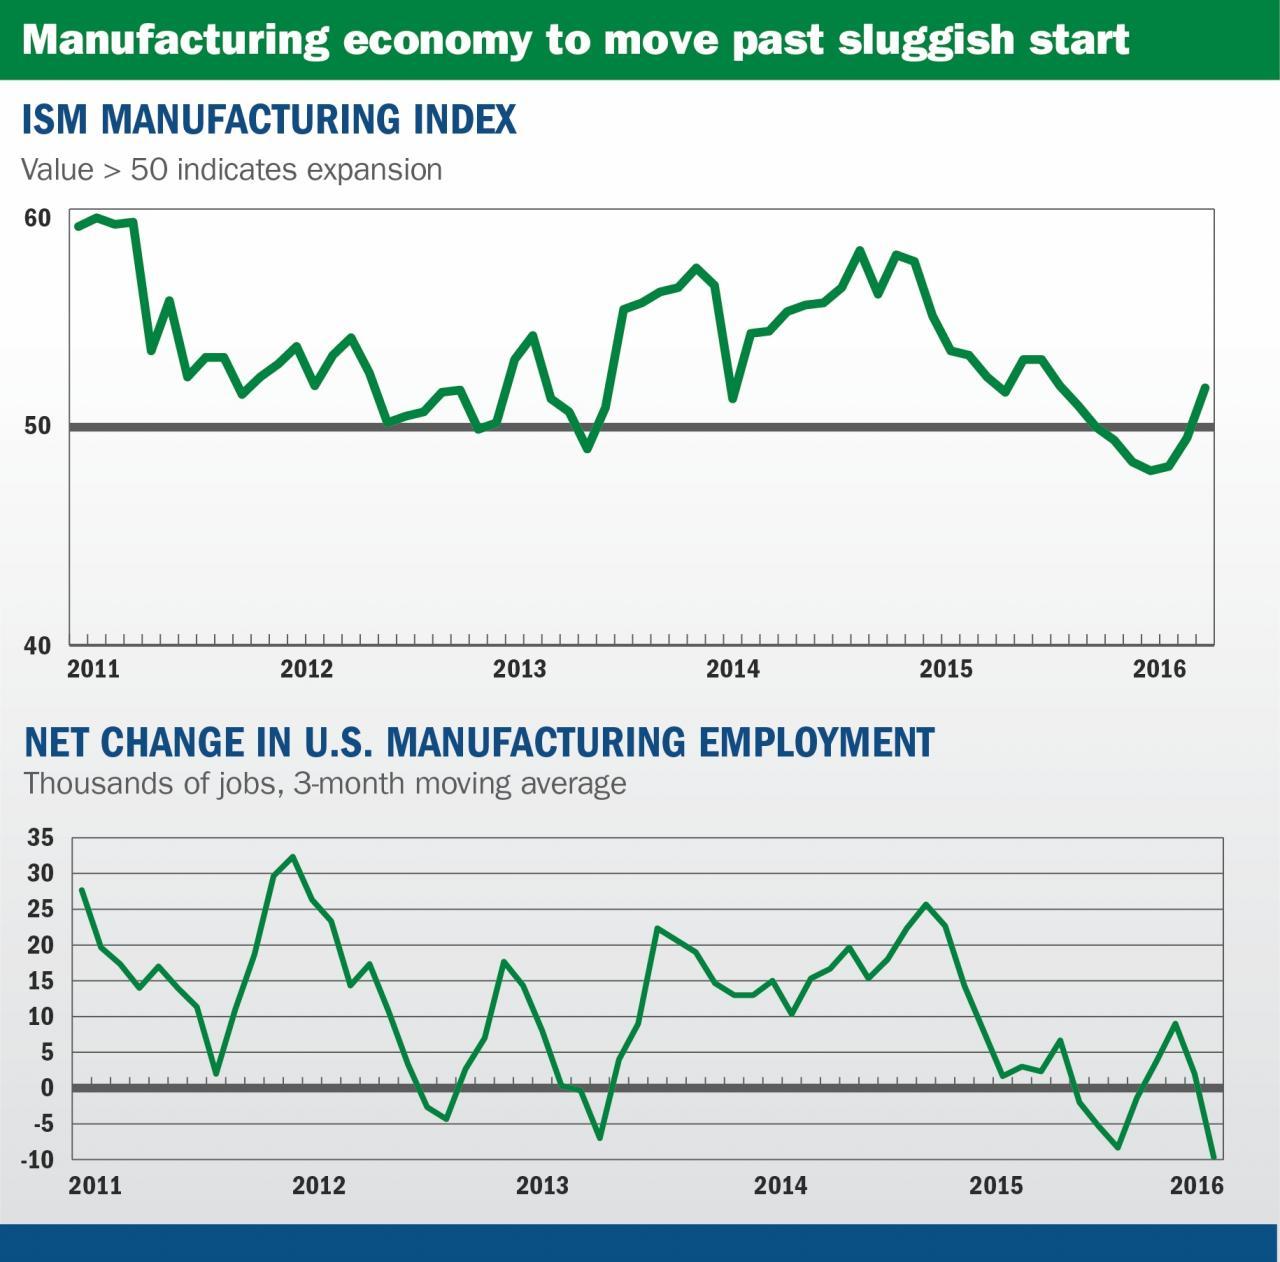
According to ISM, their Manufacturing Index (formerly known as the Purchasing Managers’ Index) for March was 51.8. A value above 50 indicates that activity levels increased in that month when compared with the previous month. This was the first time since August that the index came in above 50.
A closer reading of the data shows that manufacturers reported strong gains in production and new orders. These gains were more than enough to offset small declines in inventories and payrolls.
During periods of strong economic growth, we would expect to see gains across all components of the index. But, like I said, we are not in a period of strong economic growth. We are not really in a recession either. Let’s call it a “soft patch.” The question is whether things get better from here.
In my opinion, these data indicate that things will likely get better.
This forecast is based on the idea that new orders are a leading indicator of future business conditions, and employment levels are a lagging indicator. For almost every manufacturer, new orders will need to rise before they consider adding new employees. So if the U.S. manufacturing sector is indeed going to get past the sluggish start to this year and grow out of the recent soft patch, it is going to need sustained increases in new orders and production levels. Employment will follow shortly thereafter.

Jessica Jordan Sources: Institute of Supply Management, Bureau of Labor Statistics, Mountaintop Economics & Research Inc.
Obviously, it will take more than one good month of manufacturing data to sustain this forecast. But you have to start somewhere, and the ISM Manufacturing Index for March looks like there could be a rebound coming in the second quarter of 2016.
Manufacturing growth
So all of this analysis sounds logical enough — the trend in manufacturing employment levels follows the trend in new orders for manufactured goods. But it begs the next question: What is going to drive demand for increased levels of manufactured goods?
The answer is: rising employment levels. According the Bureau of Labor Statistics, non-farm payrolls in the United States added 215,000 new jobs in March. This increase was very close to the average monthly gain for the past four years. BLS also reported that nearly 400,000 workers entered the labor force in March, and this pushed the labor force participation rate to its highest level in two years. The employment-to-population rate increased to its highest level in more than seven years.
And one more bit of good news from the latest employment report is that average hourly wages for American workers also increased in March. So despite the sluggish data for first-quarter GDP and manufacturing growth, the U.S. labor market continues to post steady increases in both jobs and wages. These steady increases will push demand for manufactured goods in the coming months.
The one piece of bad news from the March employment report was the large decline reported in the number of manufacturing jobs. According to BLS, the number of manufacturing jobs fell by 29,000 in March. This followed a drop of 18,000 in February. For the record, the BLS figure for the total number of manufacturing jobs in March was 12.3 million.
So the decrease in payrolls that was reported in the ISM Manufacturing Index data was corroborated in the employment data from the Bureau of Labor Statistics. But like I said, the trend in manufacturing employment is a lagging indicator. This means that the data for manufacturing employment levels during the first quarter of 2016 are a reflection of activity levels of demand for manufactured goods from the third and fourth quarters of 2015.
To illustrate this relationship, I have included a chart that measures the net change in manufacturing employment levels over the past five years. If the line is above zero, it means manufacturers are adding workers. When the line is below zero it means that they are subtracting workers. A close comparison of these charts shows that manufacturers tend to add workers when their activity levels are expanding (when the ISM Manufacturing Index is above the 50-line). Conversely, manufacturers will shed workers when business levels are declining — like they did during the second half of 2015.
You probably do not need an economist to tell you that when business levels rise, manufacturers tend to hire more workers. But the economic signals have been confusing so far this year, so maybe you do need an economist to draw you a chart and try to explain just what exactly is going on right about now. I trust you will let me know whether I am right or wrong.


