June 15, 2016 Updated 6/15/2016
Email Print
Bill Wood

Higher in the highs, higher in the lows, and higher in between — few manufacturers are impervious to the inevitable fluctuations in the business cycle. But strong companies tend to do a little better than average no matter the prevailing economic conditions.
You can’t always control what’s happening in the world, but making the best of any situation is the goal of every business owner and corporate executive in our highly competitive, global economy.
When a whole industry segment is outperforming the overall industrial average, it is a good indication that industry is in a secular growth mode. Such is the case with the injection molding in the past few years. There is no doubt that the pace of growth in the plastics industry data and the overall industrial sector data have fluctuated from quarter to quarter during the current seven-year U.S. economic expansion. But for most of this time, the rate of expansion for injection molded products has tended to be just a little bit better.

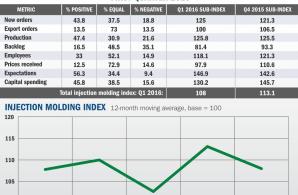
We had another example of this at the start of this year. While the growth rates for most U.S. manufacturing indicators stagnated in recent months, our Business Monitor Index for injection molders came in at a respectable 108 in the first quarter. The base for this index is 100, and experience tells me that the first quarter figure of 108 means that business levels for injection molders were moderately better in the first quarter than they were in the fourth quarter.
Just to be clear, the index value of 108 does not mean that market demand expanded by 8 percent. Nor does it mean that every injection molder reported an increase. What it does mean is that, on net, there were more reports of increases in activity than decreases.
The quarterly average for this index since we started calculating it is right around 108, and we can surmise from other manufacturing and economic statistics that overall demand for plastics products in the United States has expanded at a moderate pace of 2 to 3 percent during this same period. That is why I say that the first quarter value of 108 means business levels increased moderately, probably at an overall rate of 2 to 3 percent, for injection molders.
So what happens next? If we are to have any success in assigning reasonable probabilities to future outcomes, then we must first garner a strong understanding of both the present and the past. Thus, the predictive power of our index begins to emerge once you break the overall number down into the respective sub-indices.
As the table shows, strong gains in both new orders and production levels were reported by injection molders in the first quarter, and there also was an increase in the number of employees. We all know that new orders are the life-blood of any business, so a solid reading for this component indicates that market demand is strong. For the record, the new orders component of our injection molding index has been above 120 for five consecutive quarters.
Again, this does not mean that the market is expanding by 20 percent, but it does mean that demand has ramped up steadily during this time. I only wish I could say the same about the rest of the industry, or even the whole economy.
The fact that injection molders added more new employees than they let go in the first quarter is a good indicator of their confidence at the present time. Our survey also asks processors about their plans to purchase capital equipment in the coming months, and this too is intended to be an indicator of their confidence levels. But actually hiring new employees is a bolder act than just planning to purchase equipment, so I always want to know the direction in which the number of employees is moving. And by the way, our data indicate that injection molders actually increased their rate of hiring over the past two quarters.
Our survey also asks processors to indicate the major end markets that they supply, and to rate their respective outlooks. I was not surprised to see that the outlook for the medical sector was near the top of the list because this has been one of the most profitable segments for injection molders for some time. What did surprise me is that the agriculture/lawn and garden end market was at the very top of the list for future expectations. For the record, the end markets with the most favorable expectations in the first quarter were, in order: agriculture/lawn and garden; medical/pharmaceutical; and automotive.
In the past I have not monitored the data from either the agriculture or the lawn and garden industries as closely as other end markets such as packaging, automotive, and building and construction. But if our readers say they have strong expectations for this segment, it now has my full attention. And that is the strength to these indices — we break the data down both by type of process (such as injection molding) and by end market.
These breakdowns give our indices a lot of predictive power. So they can be used to monitor trends and make forecasts in your primary markets, and they can also capture emerging trends in markets where you have potential interests. If it sounds like I am trying to make a case for you to increase your interaction with these indices, then you are getting the message. I am making a case, and I want to hear what you think about it.
None of us can do much about the fact that we live in a time of burgeoning data, but we can decide how we are going to respond. Those of us who get it right will be able to make the best of the prevailing market conditions and perform better than average.


