Abstract:
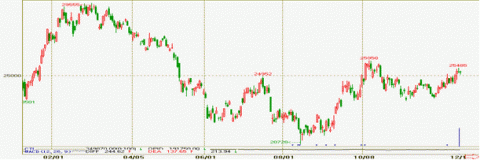
2012 Shanghai rubber was finished lower callback trend, in line with our expected early next year, and only differ slightly in volatility. January-early March upward pattern in the March 1, up to the highest point throughout the year to 29,555 yuan; early March in mid-August a downward pattern until August 14, a record annual low of 20,728 yuan from the specific trend; early August 15-10 Shanghai rubber end fell pattern appears wavelet ascribed pullback, but failed to break the 26,000 yuan and a line; latter part of the fourth quarter to around 24000-26000 yuan range wide sideways.
Overall, the 2012 natural rubber actual trend is consistent with the general direction and our forecasts. Annual report, we believe that there is a strong callback demand 2012 Shanghai rubber movements in the first quarter of the late show low after the high probability. In the semi-annual report, we have corrected the mid-term point of view, that have nearly gifted natural rubber without thought the second half of the year remained at 20000-26000 yuan range bound market performance in line with our estimate.
* Supply and demand pattern: We expect natural rubber supply surplus in 2015 will remain in the state, but will be slightly smaller surplus in 2013.Improved consumer side is the dominant factor of the price of natural rubber in the current stage. On the demand side, natural rubber consumption growth over the same period is expected to be slightly lower than the yield enhancement, but the the surplus rate would be slightly narrowed. Long term, the supply and demand maintain growth pace to maintain the relative balance situation, in a relatively stable supply at peak cycle case, the consumer side of the main change is sensitive factor.
* Downstream consumer industries: by the drag of the European car market downturn, the annual increase in global automotive production in 2012 is expected to slow to about 2.9%. 2012-2013 U.S. automobile consumption continue regression to the 1500-1600 ten thousand level; European automobile market has formed bottomed probability, the European automobile market in the next two years the Reduce drag on the extent of the global auto market; moderate trends in the Chinese auto market will continue in 2013, production and sales growth is expected in about 4-8%. In addition, the emerging car market will become a market outlook bright spot.
* Synthetic rubber industry: We believe that the promotion of green tire, leading to the synthetic rubber industry, there are two prominent trends, namely: alternative solution polymerized SBR SSBR, emulsion polymerized styrene-butadiene rubber ESBR; neodymium polybutadiene rubber substitute cobalt Department , butadiene rubber, nickel-based. At present, the domestic solution polymerized styrene-butadiene rubber and neodymium polybutadiene rubber capacity lower. The future solution polymerized styrene-butadiene rubber and neodymium Department butadiene rubber is a synthetic rubber industry development direction.
2013 natural rubber market is destined to calm the financial attributes and product attributes will be intertwined to influence the market. However, from the long and short elements expected global weak recovery and reform is expected to become China’s largest market concerns, will likely moderate to dilute the negative pressure. Therefore, we believe that environmental improvement or driven by natural rubber fundamentals to form weak recovery situation, the price of natural rubber in after of Shenfudiaozheng nearly two years after the bottom of the basic uncertain, late moderate probability of recovery is expected beneath 22000-23000 yuan strong support around 29,000 yuan above the resistance will also be obvious.
1. Natural rubber market review of the year 2012
1.1. Shanghai rubber market review 2012
2012 Shanghai rubber presents finished lower callback trend, basically in line with our expectations at the beginning of the year, only differ slightly in volatility. January-early March upward pattern in the March 1, up to the highest point throughout the year to 29,555 yuan; early March in mid-August a downward pattern until August 14, a record annual low of 20,728 yuan from the specific trend; August 15 to go up again in early October, there wavelet chonggao pullback, which was close to 26,000 yuan; around 24000-26000 yuan range in the mid to late 10 wide sideways. As of December 19, Shanghai rubber index closed at 25,226 yuan, the highest point during the year to the lowest point of maximum decrease of 29.87%. Specific trend is broadly divided into four stages:
Figure 1: Shanghai rubber index Japanese K Line Chart (Unit: yuan / ton)
Source: Man Huazhong permit Futures Research Department
Phase I: January Shanghai rubber break the the sideways shock interval the end of 2011, showed a strong rebound in demand. This wave of strong rebound continued until March 1, a record 29,555 yuan, which was close to the highest point of the year in late November 2010 and early May 2011 along the two fell interval. The stage or up to 25.76%.
Phase II: March 2 to August 14, Shanghai rubber 30,000 yuan integer off by a lot of resistance, lower volatility. July rebounded slightly but the fundamentals are vulnerable lead to downstream channel back in August, and hit the lowest point for the year of 20,728 yuan, approaching the lows of 2010 Shanghai rubber began to rise before the callback 20,364 yuan. The stage of a decrease of 29.87%.
Phase III: August 15 to October 11, Shanghai rubber a wave of a strong rebound.Magnitude more powerful than in July callback, October 11 record years of band time high point of 25,958 yuan, 26,000 yuan pressure barrier but failed to effectively break. The stage or up to 25.23%.
Stage IV: October 12 to the end of the year, the upward momentum Shanghai rubber slightly inadequate fluctuated around 24000-26000 yuan range, the trend is slightly on the strong side, 23,500 yuan above the performance of the strong support for the strong performance of the end of Onchocerca rebound, but always failed to break the 26,000 yuan integer relations.
1.2. Day rubber2012 market review
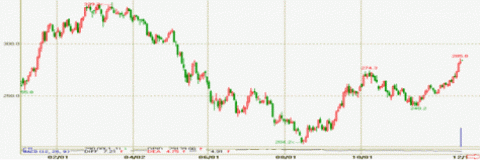
Day rubber in 2012, the basic trend consistent with Shanghai rubber was Xianyanghouyi, and then rebounded slightly, eventually a bit more range bound pattern. More volatility than Shanghai rubber the slightly stronger. Uplink pattern in mid-January to March, up 30.3%; downlink pattern of a drop of 39.7% in mid-August in mid-March; pulled back slightly in late August – October 5, 2011, or 34.1%; end of late appear strong move, breaking a 10-month high. As of December 19, the day plastic index closed at 284.2 yuan, the highest point during the year to the lowest point of maximum decrease of 39.77%. Specific phased to see:
Figure 2: the day plastic index Japanese K Line Graph (Unit: yen / ton)
Source: Man Huazhong permit Futures Research Department
The first stage: In early January, the trend of the Japanese rubber began pulled up, break the end of 2011, the bottom of the shock interval, the rally continue until March 14, 2012 and hit a high of 339.3 yen this year.
Phase II: March 15 to August 14, on plastic trend showing an overall downward pattern, although technically early July, a slight pullback, but due to the diversion of the fundamentals are weak pattern, on plastic eventually choose to continue down to 8 February 14, hit a year low of 204.2 yen. The stage of a decrease of 39.77%.
Third stage: from August 15 to October 5, the date of glue 34% band callback pattern callback high of 274.3 yen in 2010 glue began to rise before the callback low range. Mainly affected by the main natural rubber producing countries support policies, and global macro-easing policy to boost the role.
Phase IV: October 6 to the end of the year, on plastic was range bound, slightly stronger than normal pattern. Shock interval of 240-280 affected by the depreciation of the yen strong late rally, breaking the October 2012 highs.
Overall, the natural rubber market is slightly weak performance in 2012, summed up its internal characteristics. To Shanghai rubber, for example, on the one hand, volatility compared to 2011 changes. 2012 days amplitude over last convergence, single-day amplitude 1% -2% of the trading days accounted for 47.2%, while only 36.5% in 2011, more than 4% only 3.4% of the amplitude of a single day in 2012, while in 2011 as compared to 11.5%.
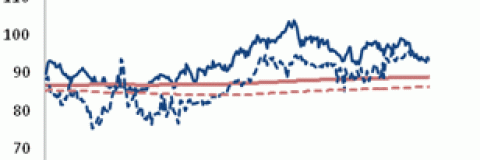
On the other hand, Shanghai rubber Day glue parity mean appear elevated. Since 2012 the ratio of long-term deviation from the mean, resulting parity mean rose to 89, the 2011 annual average of 85 in mid-December 2012, after the strong performance of the Japanese rubber, both parity appears regression, as of December 19, the two price ratio was 88.9, and have been very close to the mean.
Figure 3: Shanghai rubber index days amplitude distribution
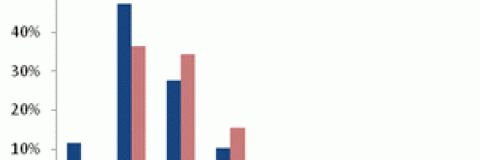
Figure 4: 2012 Shanghai rubber day plastic price relationship between
Source: Man Huazhong permit Futures Research Department
2. Natural rubber viewpoint Review in 2012
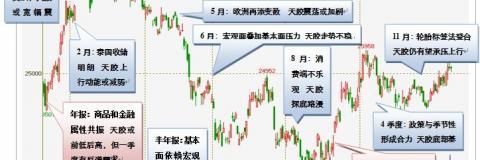
Overall, the 2012 natural rubber actual trend is consistent with the general direction and our forecasts. Annual report, we believe that there is a strong callback demand 2012 Shanghai rubber movements in the first quarter of the late show low after the high probability. In the semi-annual report, we have corrected the mid-term point of view, that have nearly gifted natural rubber without thought the second half of the year remained at 20000-26000 yuan range bound market performance has been largely in line with our forecast.
September natural rubber performance differences, but with my monthly report viewpoint presented is consistent with the semi-annual report viewpoint. August industrial policy efforts, our point of view is a bit cautious, and found it difficult to offset weak consumption and supply peak repression, so that the bottoms trend will continue. But after the macro and industrial policy than-expected, especially in Thailand through the purchasing and storage policy, macroeconomic policy, to form a joint force, natural rubber Chart rebound.
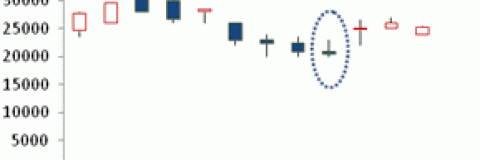
Trend of the fourth quarter, slightly weaker than we expected, mainly basic digestion producing countries to cut exports and purchasing and storage double positive superimposed driver market in September, October surface is relatively flat overall commodity market in October showed signs of fatigue form drag. The ANRPC increase annual production to increase the supply of heavy pressure, high inventories of natural rubber to suppress the formation of the spot price. In addition, the limited effect of the policy side, the domestic car to the countryside has not yet been cashed, and the United States, Japan, easing less than expected effect of market incentives, and the U.S. fiscal cliff and the European debt crisis unresolved, causing some inhibition on the market. The effect of a combination of factors, result in the fourth quarter, slightly stronger than natural rubber showed only rangebound pattern.
Figure 5: 2012 on K-line of Shanghai rubber index trend
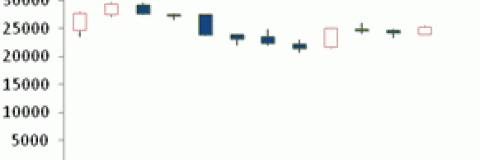
Figure 6: 2012 our monthly report view
Source: Man Huazhong permit Futures Research Department
Figure 7: Shanghai rubber perspective REVIEW Figure
Source: Man Huazhong permit Futures Research Department
3. Global natural rubber supply and demand balance analysis
The natural rubber industry chain is not long, but show different properties due to supply and demand side, resulting in a slight lack of stability of supply and demand balance. First, natural rubber long cycle growing crops, supply elasticity is relatively small, but natural rubber have the attributes of agricultural products, and therefore affected by the weather and local abnormal weather may lead to the production impact, extreme weather or less, so overall supply is fairly smooth;, natural rubber downstream automotive industry with a strong industrial properties, but also influenced by the macroeconomic cycle, the downstream consumption volatility is even more obvious, easier transition leading to a balance between supply and demand.
3.1. Rubber supply and demand remain in the cycle off
From the historical data, the pattern of supply and demand of natural rubber in the before and after 2000 there have been large changes, most years before 2000 natural rubber market is in a state of oversupply is not obvious, but the supply and demand surplus. Basically followed in 2000 after nearly 10 years in a tight supply-demand equilibrium, two obvious supply and demand pattern reversed in 2006 and 2008, the former main production surge, while the latter is mainly due to the financial crisis under rubber consumption shrinking dramatically.
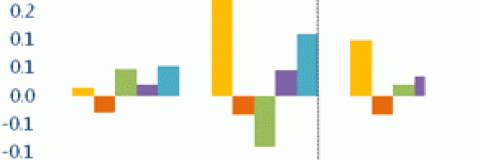
Natural rubber demand in the past 20 years, the basic maintenance of long-term upward trend, an annual increase of basic maintenance around 4%, of which 90% year demand growth in 2000 to the tech stock bubble in 2001 and 2008 to 2009 alone the global financial crisis representing a slight decline. Look at data from the past 10 years, the main driver of growth in demand from car sales brought about by the rapid economic growth of China and other emerging economies continue to improve. Natural rubber consumption improvement mainly from the drivers of economic growth; addition, the volatility of the price of gasoline will affect the consumption of the car, particularly evident in the U.S. market. From a situation of the past three years, in addition to the 2010 natural rubber demand quick fix, the next 2 years, the growth rate of consumption of natural rubber overall slow global economic downturn and the rapid rise in gasoline prices over the same period are the main factors.
Figure 8: natural rubber supply and demand balance for the past 20 years
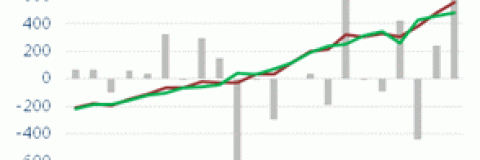
Figure 9: natural rubber demand growth driven
Source: IRSG CSI futures Research Department
Natural rubber as only natural products, chemicals supply chemicals long production cycle characteristics, but also has the agricultural products in the production characteristics of the short-term adjustment difficult.Therefore, in the past 20 years, small changes of the natural rubber supply, the standard deviation of output growth was only 4.3%, lower than the 4.6% of the demand, but also much lower than the other chemicals. Driving factors of the natural rubber supply point of view, the past 20 years, in addition to external factors such as policy and resources, the demand and price are the main factors affecting the yield change. Supply trends from the past 10 years, from 2004 to 2006, prices continued to promote the rapid growth of the rapid promotion of the natural rubber acreage in 2006 to 2008, calculated in accordance with natural rubber planting period of 5 to 7 years, 2011 to natural rubber production capacity to focus on the release of Year 2015, which is also in line with actual production data. State of natural rubber in 2011 to 2012 with an annual output capacity focused on the release and the same period demand growth has stagnated, the natural rubber in the past 2 years within the past 10 years by the previous long-term supply tight balance into surplus supply and demand, the supply and demand surplus proportion more similar to about 1996 to 2000.
3.2. Natural rubber supply and demand analysis
The lower the price elasticity of demand: The main use of the natural rubber for the tire and automotive industry, tire lower proportion of the cost of vehicles, so the lower the price elasticity of consumption. Change the correlation of the fluctuations in the price of natural rubber and yield of around 50% in the past 20 years, and basically do not have a significant correlation degree; However, overall demand showed some cyclical, had a strong correlation with the macro cycle.
Capacity growth has inertia: natural rubber main producing countries and regions more to agriculture as a major industry, the general policy will tilt from historical data, natural rubber production capacity, that is, the growth of the planted area has a strong the inertia generally maintain a similar growth rate in the 3 to 5 years of industry cycle.
Difficult to adjust short-term production: the cost of natural rubber cultivation is mainly in fixed investment, and low variable costs; put into operation after the new production marginal cost is close to zero, while the demand for lower consumption elasticity; However, due to the natural rubber supply monopoly is relatively low, the major rubber producing countries is difficult to adjust market supply by controlling the production, Therefore, even if the demand is weak, short-term natural rubber production is difficult to effectively adjust.
3.3. 2013 supply surplus narrowed slightly
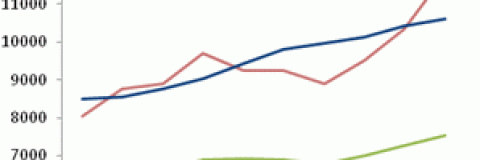
We expect natural rubber in 2015, will remain in the state of the supply surplus, but surplus in 2013 will be slightly smaller. From a supply-side perspective, is still in production capacity concentrated release period 2003-2012, an average annual growth rate of 2.49% for natural rubber acreage; during the period 2006-2008, the year-on-year growth rate of the surface of natural rubber cultivation in 2011 in 3-4%, more than the historical average, based on natural rubber planting cycle, we expect that within the next three years will continue in the trend of rapid growth in production. End from the demand point of view, based on our macro group for the next five years, the global economy will enter a low-speed development of the overall outlook natural rubber consumption growth over the same period is expected to be slightly lower than the yield enhancement, but the the surplus rate would be slightly narrowed , mainly due to the growth in demand will be slightly higher than in 2012.
Long term, the supply and demand maintain growth pace to maintain the relative balance situation, in a relatively stable supply at peak cycle case, the consumer side of the main change is sensitive factor.
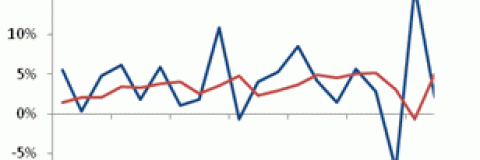
Figure 10: natural rubber consumption and economic growth comparison (unit:%)
Source: WIND Securities Futures Research Department
Figure 11: natural rubber production and acreage comparison (Unit: kt, thousand hectares)
Source: ANRPC Securities Futures Research Department
Translated by Google Translator from http://market.cria.org.cn/20/12122.html


