4. Natural rubber upstream industry review and outlook
4.1. Natural rubber supply chain overview
Natural rubber is a typical resource constrained, the more stringent requirements of the natural conditions of the geographical environment, soil, climate, humidity, hi, high temperature, high humidity and calm wind, fertile soil, therefore, suitable for the growth of natural rubber area is concentrated in a few tropical countries, in theory, are mainly distributed in less than 15 degrees of latitude north and south, due to the constraints of the natural conditions of the world’s natural rubber acreage increased from about 3.9 million hectares in 1961 to 11.23 million hectares in 2012, an average annual growth of only 2.3% or so.
Relatively inelastic supply of natural rubber, natural rubber is a long-term crops, planting 5-7 years to start tapping, tapping period of 25-30 years, production in 2012 from about 210 million tons in 1961 and 11.44 million tons in general The annual increase in 2011 before fluctuations mean average annual growth rate of around 3%, while the last two years, the growth rate increased in 2011 and 2012, an increase of 8.7% and 5.8%, respectively.
Figure 12: natural rubber planting area in Southeast Asia (Unit: thousand hectares)
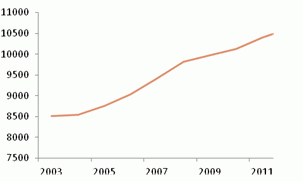
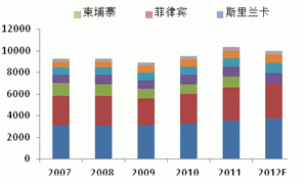
Figure 13: ANRPC member countries natural rubber production (Unit: kt)
Source: ANRPC Securities Futures Research Department
4.2. Natural rubber the upstream industry production regional structure analysis
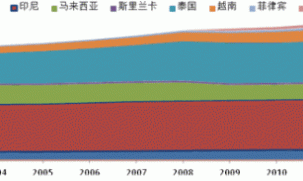
Natural rubber producers concentrated in the Southeast Asian region accounted for 90% of the world acreage, producing countries including Thailand, Indonesia, Malaysia, India, China, Vietnam and Sri Lanka, Thailand, Indonesia and Malaysia, the area under cultivation, accounting for 70% .
The past 10 years, the development of the three main producing countries are also some differentiation, the average growth rate of Thailand was 4.5%, Indonesia 0.4%, and -1.4% in Malaysia, therefore, lead to the production in Indonesia in recent years to replace Malaysia bits ranked second, and even India, Vietnam is also close to the production levels in Malaysia.
In addition, Africa, Burma, Cambodia, Laos in recent years, the rapid growth, an increase of over 10%, and northeast Thailand, northern begin development of a larger area planted large processing plants are turning to investment in plantations.
Figure 14: The the ANRPC member states natural rubber planting area (Unit: thousand hectares)
Source: ANRPC Securities Futures Research Department
4.3. Natural rubber the upstream industry production mode analysis
Basically be divided into two major parts, glue production and processing of natural rubber production chain to produce two links, while Thailand has a huge two providers, therefore, can usually be understood as three parts.
Rubber plantations, mainly from tapping rubber number, global rubber plantation basic mainly small rubber plantation, accounting for 80-90%, only China is concentrated in two major land reclamation, accounting for 50%, but after the reform of Yunnan Agricultural Reclamation also decentralization of Hainan State Farms accounting for about 30%; tapping certain cyclical, Yunnan, China general in early March to early December, Hainan, at the end of March to the end of December, the production peak in May-October; Southeast Asian low-yielding period February to May, the peak period of July to December.
Two suppliers, the equivalent of traders, the privatization of 90% due to Thailand rubber plantation, scattered in thousands of families in the hands of the rubber farmers, resulting in raw materials are too scattered, combined with the rubber farmers hoarding capacity is limited, two providers have emerged, two providers The annual trading volume of over one million tons in Thailand.
Processing plants, natural rubber into circulation usually latex or rubber, rubber plantation production of glue to processing factories into circulation. Global rubber processing plant is expected to nearly 500; 145 Indonesia; Thailand more than 100; Malays about 40; 40-50 over China.Hainan, Yunnan Agricultural Reclamation, Sinochem International, Guangdong Nongken rubber processing plant in China, combined with advanced, of Shanghai Giant associated private factories.
4.4. Natural rubber upstream industry exports
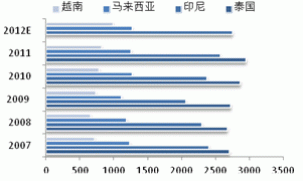
Both major producing countries in Southeast Asia, is also a major exporter, from the structure of the world’s natural rubber exports to Southeast Asian countries, exports accounted for about 90% of the proportion of the world’s total exports, but also in Thailand, Malaysia, Indonesia’s exports to the three countries accounted for total global 70-75% of the export volume, but some producing countries an increase in demand, the export situation is also undergoing some changes, net export volume to reduce the situation in Malaysia and India, Vietnam exports come from behind in 2011, accounting for 10%.
Figure 15: Global export structure (unit:%)
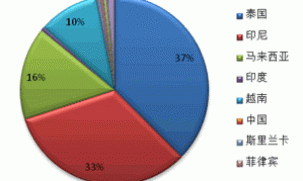
Figure 16: The main natural rubber producing countries export changes (Unit: kt)
Source: ANRPC Securities Futures Research Department
4.5. Natural rubber the upstream industry technology development level analysis
Technological processes of the natural rubber industry is relatively mature, the development of certain bottlenecks, there is also a certain differentiation. Natural rubber upstream technology development is focused on two production: planting links focused on the increase in production, processing part of focus in terms of quality.
Strains of optimization and tapping technology to improve focus on the growing links in the optimization of the varieties that cultivate high-yielding, early open cut, wind, disease and natural disasters such as the ability varieties. But also a longer cycle natural rubber is a long-term crops, cultivation of new varieties developed technology advancing is relatively slow; although in recent years some of the glue amount of include ethephon other chemical supplies to stimulate the use of improved, but never been able to fully resolve therefore with to damage to the gum trees.
More focused on management and training, it is difficult to form a qualitative breakthrough in tapping the technical aspects, in recent years, it is learned, Malaysia and other countries try to explore the direct stimulation of ethylene gas micro-cutting technology, improve labor efficiency at the same time, to reduce the amount of consumption of leather rubber tree help dead skin tree complex cut, thereby enhancing the the gum forest long-term production capacity and reduce costs, but also the fresh results.
In the processing sector, the main direction of the development of technology for the needs of downstream users, on the basis of standard rubber to produce a variety of special rubber production processes to reduce downstream customers. In addition, research, the use of different additives, performance is also one of the direction of the main technical development in the field to improve rubber products.
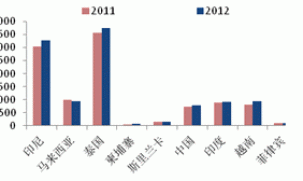
In addition, because of differences in technology and the natural conditions of production glue country’s yield difference of nearly 10 years, India, Indonesia, Malaysia, Sri Lanka, Vietnam, the Philippines presents significant growth, in 2012 compared to 2003 in Sri Lanka yields upgrade nearly 50 %, Indonesia and the Philippines to enhance also reached 37%, but China, Thailand and Cambodia yields almost stagnated and even declined slightly.
Figure 17: 2012 ANRPC member countries tapping area distribution (unit:%)
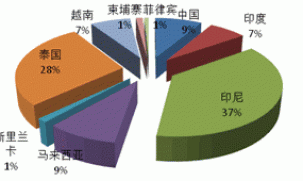
Figure 18: ANRPC members of the domestic rubber (Unit: kt)
Source: ANRPC Securities Futures Research Department
4.6. Analysis of natural rubber upstream industry
Natural rubber prices experienced over 2002-2006, and 2009-2010, the two sharp rise in natural rubber planting effectiveness to attract the accelerated expansion of acreage in recent years intensified global scramble for resources, natural rubber is an important strategic resource raw materials, demand growth under the Forced-producing countries also continue to expand production, resulting in 2011 to enter the supply peak cycle, approximately 11.1 million tons of global production in 2012 is expected to continue to dampen demand, coupled with the financial crisis since 2008 the improvement, and ultimately makes the upstream supply presents a relaxed situation. From ANRPC the data show nearly 120 million tons of natural rubber stocks in 2012, reaching a new high in recent years, therefore, in this context, natural rubber producing countries forced to introduce measures to cut exports and moderate cut production.
From the production structure, Thailand is still the largest producer and exporter. In addition, from the upstream processing sectors, excess capacity is more serious, global natural rubber processing overcapacity According to preliminary statistics, about 25%. Although the three Southeast Asian countries accounting for 70% production, but there is no natural rubber pricing, pricing center for natural rubber the three trading market in Japan, Singapore and China.
4.7. Natural rubber industry development forecast upstream
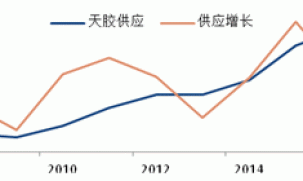
Consider the importance of the strategic resources from the perspective of the planting rubber plantations or processing plants in Southeast Asia will become a non-tropical regions of the development goals of the country, therefore, the future of the global natural rubber acreage will continue to maintain a steady growth in technology can not break through the case, it is expected that the global supply will be steady growth, it is difficult to appear improved by leaps and bounds, according to the IRSG forecast 2020 global natural rubber production will reach about 16.5 million tons.
Vietnam there are still a large development space, retaining its position as the world’s third big rubber producing country in the future from the point of view of the structure of production, it is expected that, in the case of palm oil to compete for Malaysia share gradually decline; China because of geographical reasons, expansion space is limited.
From a processing point of view, it is expected that the differences in the level of excess capacity and production technology, the future is bound to lead to the situation of the implementation of an integrated, eliminate backward processing plant will be the trend of the times.
Producing countries from competing for the pricing aspects presented enhance processing capacity demand, increase tire factory in Thailand introduction, I hope to get some balance in supply and demand, which compete for greater pricing power.
Figure 19: The total production forecast trends (unit: tons,%)
Source: ANRPC Securities Futures Research Department
5. Natural rubber downstream industry analysis
Downstream of the natural rubber consumption chain and not too long, the tire industry consumer end of the main natural rubber, accounting for 70% of the total global natural rubber consumption; the galoshes, wire and cable, respectively, accounting for 8% and 10%.
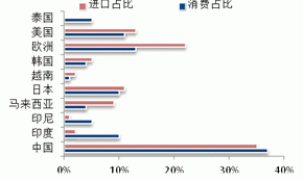
From nearly 10 years of natural rubber regional consumption structure analysis, Asia is pulling the main power source of natural rubber consumption growth. , Chinese natural rubber consumption accounted for 37% of the total consumption of the world’s natural rubber, natural rubber imports accounted for the world’s natural rubber exports 35% of the total, is the world’s largest natural rubber consumer, importing countries. The world for the past 10 years about 60% of the new natural rubber demand from China’s growth, since 2001, China’s basic needs to maintain normal growth; However, car ownership in China is lower than in Europe and the United States, and therefore is not a major consumer of the tire, The tire industry is export-oriented industries, will also be a greater impact of the external environment, the economic downturn in Europe and America, the automotive industry has been hit hard in the financial crisis of 2008, Chinese tire exports and natural rubber demand is also down significantly.
However, starting in 2010, China’s natural rubber demand growth gradually toward the inward-looking change, on the one hand, the slow growth of the economies of Europe and the United States, personal consumption weak drag on its automotive and tire needs the same period in Chinese consumption continues rapid growth; On the other hand, the global trade policies tend conservative, tire case of special protection and the upcoming implementation of the labeling law are to some extent inhibited the Chinese tire export. We expect that within the next five years, the proportion of China’s tire exports will continue to further reduce the car and tire sales growth in China will become a natural rubber consumption growth endogenous motivation.
Based on our macro group and metal group is relatively optimistic expectations of a global economic recovery in 2013 and the growth of China’s auto consumption, we believe that the world’s natural rubber consumption in 2013 is expected to slow to restore growth, China is still the main driver, U.S. auto sales quickly upgrade enhance the natural rubber demand, Europe is still the biggest uncertainties. According to IRSG expected, the global natural rubber consumption in 2013 was approximately 11.7 million tons, a year-on-year growth rate of 4.5%.
Figure 20: Global natural rubber consumption patterns (unit:%)
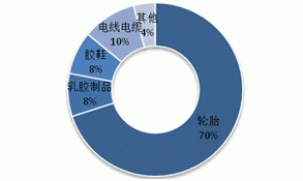
Figure 21: global pattern of natural rubber imports (unit:%)
Source: ANRPC Securities Futures Research Department
5.1. Global automotive industry analysis
Overall, the global automotive industry to maintain a 3.6% annual compound growth rate of vehicle production in 2005 to 2012 showed a rising trend. In phases, the development of the automotive industry and the economic environment has a high degree of correlation. The impact of the global financial crisis in 2008, the automotive industry downturn, vehicle production declined for the first time in 2008, the 2009 car production hit a 7 years, the lowest value; 2010, the automotive industry is getting into the recovery phase, production recovered to 77.609 million, an increase of 25.8 %. In 2011, car production increased by 3.2% to 80,092,800, and recovered to the normal level of development.
From global automotive production area structure, presents the trend more pronounced shift from west to east in the nearly 10 years since, about 80% of production in the automotive machining for the low-end manufacturing sector since 2005, global automobile production is beginning to show in Asia, Europe and North America the “three pillars” of the situation, the three market share accounted for 39.6% of the global market share of 30.3% and 24.2%, respectively. 2009 Asian car market share rose to 52.6 percent, ranking the world’s largest auto market fell to 26% and 14.1% respectively in the same period in Europe, North America market share. In 2010, the four vehicle power production in the United States, Japan, Germany and France share fell to 30%. However, from nearly two years of national policy-oriented point of view, Europe and the United States manufacturing sector showed some reflux trend or a certain impact on the distribution of automotive processing.
At present, the global automobile market is moderate growth period, and we think it was mainly dragged down by the European auto market downturn, as well as the impact of the global economic slowdown. Expected annual increase in global vehicle production in 2012, slowing to 2.9%.
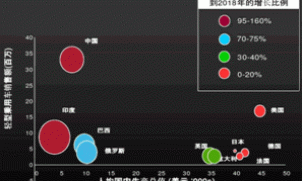
Future trends, the development of the global automobile market will enter a transition in 2013. Mainly in emerging countries will become an important global automotive market, the market share of European and American veteran automotive powerhouse gradually shrinking. Is expected in the next 3-5 years, the pattern of global automotive production will shift to emerging markets “thriving”. The data can also be seen in 2018, China, India, Brazil and Russia will dominate the world’s major auto market forecast from LMC.
Figure 22: 2005-2012 global vehicle production (Unit: million)

Source: WIND Securities Futures Research Department
Figure 23: 2018 top ten auto market
Source: LMC Automotive Forecasting in the Futures Research Department
5.1.1. European and American automobile industry development
5.1.1.1. American automotive market development analysis
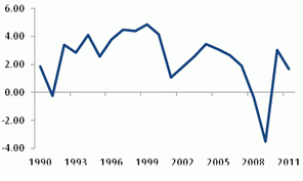
From the analysis of the development, we found that the U.S. auto sales and GDP data showed a significant positive correlation.
The U.S. auto industry and consumer constitute the main driving force of the U.S. economy, the proportion of about 12% in 2011. The United States is the high debt countries, the economic growth rate will directly affect the consumer, thereby affecting the demand for cars and tires, we found that the U.S. auto sales and GDP data showed a significant positive correlation.
Sharp dive look at data from the past five years ,2008-2009 U.S. GDP data, the significant downturn in U.S. auto sales during the same period, the year decreased by 18%, from 21.4% to 13,493,000 and 10,601,400, fell to the lowest level in nearly 20 years . 2010, following the rebound of GDP, the United States auto market started to recover, car sales year-on-year growth of 11.5% in 2009 to 11.96 million, ending four consecutive years of declining trend.
From automobile production and sales structure analysis, 2012 young car 40% (including cars, light trucks 57%) production accounted for 97% of the total production of the car, indicating the development of light vehicles direct impact on the overall development of the automobile market in the United States.
Figure 24: new car sales in the United States 1990-2012 (Unit: one thousand)
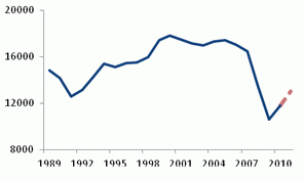
Figure 25: GDP growth in the United States 1990-2011 (unit:%)
Source: WIND Securities Futures Research Department
From the current analysis, we believe that the United States auto market in 2012 in a modest recovery phase.
First, the U.S. auto production and sales models and monthly tracking, the judge basically decided in the U.S. auto market growth in 2012. The reasons are the following:
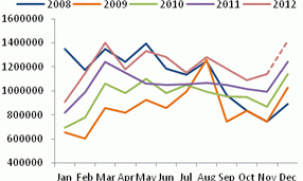
A monthly consumption season performance dominated the automobile market performance for the whole year. U.S. light vehicle sales monthly data over the years, throughout the year, consumer highs in March, May, August, and December. March 2012, May, August light vehicle sales ring than the increase amounted to 22%, 13% and 11%, respectively, the previous period growth estimates, we initially expected auto sales is expected in December rose 12.5% year-on-year.
Second, from the whole year, the U.S. light vehicle production increased by more than 10% in 2012. In November 2012, U.S. light vehicle sales of 1,143,916 vehicles, an increase of 15.0% in January-November, the cumulative U.S. light vehicle sales of 13,136,306 units, 11,535,196 units compared to the same period last year, a year-on-year growth of 13.9%, according to the November sales rate as well as the historical increase projected 2012 annual sales in the U.S. auto market will reach 15.56 million, second only to January 2008 15,590,000.
Figure 26: U.S. vehicle production (units: vehicles)
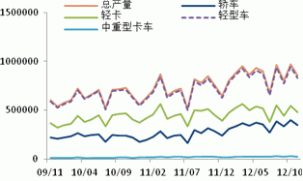
Figure 27: U.S. light-vehicle sales data (unit: quantity)
Source: WIND Securities Futures Research Department
Translated by Google Translator from http://market.cria.org.cn/20/12122_2.html
Read more:
- 2013 natural rubber investment strategy report (part 1)
- 2013 natural rubber investment strategy report (part 3)
- 2013 natural rubber investment strategy report (part 4)
- 2013 natural rubber investment strategy report (part 5)


