5.2. Global tire industry analysis
From the development pattern analysis, the pattern of the global tire industry is more stable.
In 1996-2011, the global tire industry ranked the market share of the three enterprises has remained at more than 40%, while the income share of the industry before the 75 strong has remained at 96% -98%. 2011 industry top three Bridgestone, Michelin, Goodyear occupy a market share of about 46.7%, about 69% of the market share of the 10 companies in the industry, the tire industry market concentration.
In terms of regional distribution, the global tire market pattern dominated by the leading enterprises in Japan, the United States, France and South Korea.
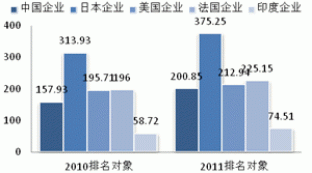
Japanese enterprises operating income accounted for approximately 25.7%; followed by France and the United States, the two business accounted for 15.4% and 14.6%, respectively. Corporate look, first, Japan Bridgestone 2011 operating income accounted for 16.7% of the total of 75; French Michelin ranked second in 2011, operating income accounted for 15.4% of the total 75; Third name Goodyear business accounted for 11.6%.
Figure 46: The number of ranking of the top 75 enterprises of global tire industry (unit:)
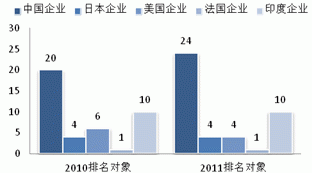
Figure 47: income ranking of the top 75 global tire industry (Unit: 100 million U.S. dollars)
Source: WIND Securities Futures Research Department
From the development trend, we believe that the tire industry trends are mainly reflected in two aspects. The tire industry from the Bias pattern tire radial tire conversion growth of the in developing countries radialization rate will speed up. Second, energy-saving, noise reduction, safety, environmental protection, green tire to become the new direction of development of the industry, the introduction of European tire labeling law, is expected to dominate the direction of development of the green tire in a longer period of time.
Looking ahead, we believe that the pattern of the global tire market will maintain the status quo, the With global macroeconomic rebound, the tire industry will be the first to benefit from the investment in fixed assets and increase traffic, green tire is the rapid development of the tire industry leading product segments.
5.2.1. Chinese tire industry
From the development pattern analysis, tire companies in China the number of small-scale, single export market structure.
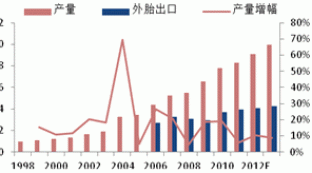
China is the world’s tire production superpower, the total output accounts for about 1/3 of the world tire production. Phased to see from 1998 to 2010, China’s tire production stage of rapid development, except during the 2005, 2008 China’s tire output growth of about 5%, the average annual growth rate of the rest of the year at 19.7%. Significant slowdown in China’s tire output growth after 2011, the year on year growth fell to 6%, the slow growth period.
Figure 48: China’s tire production is exported annual data (Unit: one hundred million,%)
Source: WIND Securities Futures Research Department
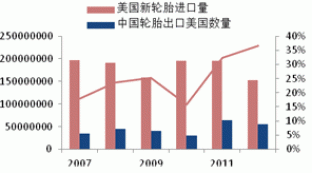
Figure 49: China tire share of U.S. imports of tires (Unit: Article)
Source: China rubber trade network card Futures Research Department
See from the scale, in 2011 the Chinese tire companies in the global top 75 companies accounted for 24, a large number of enterprises, but the scale of strength is weak, the main products in the low-end. Accounting for 32% of the number of Chinese enterprises from 75 top global tire enterprises operating income situation, the 2011 finalists, total operating income amounted to $ 20.085 billion, less than an operating income ranked second French Michelin tire.
Analysis of China’s tire exports, tire exports accounting for export markets with certain characteristics. First, exports accounted for the proportion of total production declined. Tire exports accounting for total output of nearly 60% in 2009. The proportion of exports suddenly dropped to 45.6% in 2009; 2010, a substantial increase in the domestic tire production in 2011, but the proportion of exports only rebounded slightly to 47.41%, 48.07%. Analyze the reasons, we believe that on the one hand due to the special protective case led to Chinese exports, open up new markets overseas surviving a certain lag; On the other hand, due to the rapid development of the domestic auto industry led the growth in consumption of the domestic tire.
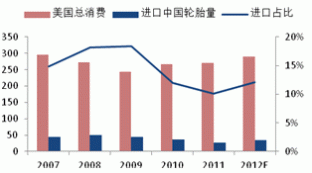
Second, the United States is the major regions of China’s tire exports, China is the primary source of U.S. tire imports. Phased look after the implementation of the special protective case in 2010, the proportion of steep drop to 15.81%., 2009, Chinese tire imports accounted for U.S. tire proportion of 25.25%; Case of special protection during the implementation, the China tire accounting the tires share of U.S. imports fell from 18% in 2009 to 12% in 2011, while total U.S. passenger car / light truck tire consumption in 2009 and 2011 has increased by 12% to 270 million . In 2011, the proportion of domestic tire exports rebounded slightly, which accounted for a larger proportion of U.S. imports recovery. We believe that the U.S. market demand to expand the results, the U.S. auto market in 2010 into the recovery phase, will be expanded on tire demand, the increase in demand has weakened the impact of the special protective case.
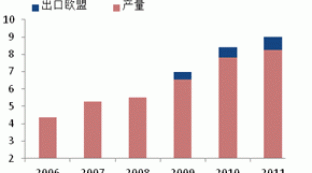
The European market accounted for a slight increase, but the overall small-scale. Data show that from 2009 to 2011, the tire of China’s exports to the EU accounted for the proportion of the total tire exports were 15.15%, 16.31%, 18.43%, the amount of exports rose annually, accounting for 16.17%, 17.24%, 19.56 %.
Figure 50: The total consumption of the U.S. tire imports from China (unit: ten thousand)
Source: WIND Securities Futures Research Department
Figure 51: China’s tire exports to Europe (Unit: one hundred million)
Source: MTD, Rubber Association, Securities Futures Research Department
Analysis from the status quo, the development of China’s tire industry slowdown in corporate profit and loss situation slightly improved.
In 2012, China’s tire exports accounted for a total production of less than 50%. From production in 2012, the only 2,3,6 months year-on-year increase of over 10%, increase in other months are below 10%, highlighting the tire industry presented must destocking process.
Tire export side, the end of the special protective case, on the one hand, the domestic tire exports constitute signs of getting better and better. As of October 2012, China’s tire accounted for the proportion of the U.S. tire imports rose to 36.6%. On the other hand, constitutes a good semi-steel radial tire production enterprises. Because, the special bonded for passenger and light truck most of the corresponding semi-steel radial tire According to our previous analysis of the passenger car and light truck tires can be speculated that the total demand accounted 91%.
Figure 52: loss position of the tire industry (Unit:%)
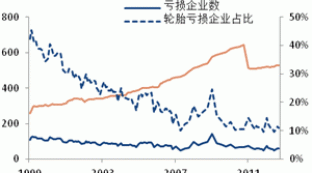
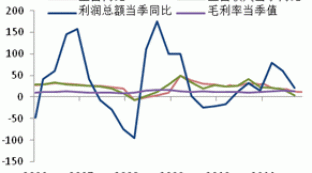
Figure 53: Financial Indicators of the domestic tire industry (unit:%)
Source: WIND Securities Futures Research Department
Regarding operations. Tire industry growth to slow down, but profits rise. Financial data analysis, the end of October 2012 the total assets of the tire industry was 332.4 billion yuan, the growth rate dropped to 10.39%; compared to 201 17.99% year-on-year growth, significant decline. January to October 2012, the tire manufacturing industry total sales revenue of 384 billion yuan, a year-on-year growth of 11.58%, an increase of 30% lower than the same period last year; total profit of 21.657 billion yuan, a year-on-year growth of 48.24%, an increase of 19.57% more than the same period last year. The third quarter of 2012 gross margin year-on-year increase of 12.92%, 9.95% higher than the same quarter last year. Corporate profit and loss situation continued to improve slightly, WIND’s data show that in October, the statistics of the 527 tire manufacturer, a loss of 58, accounting for 11%. Overall, a slight increase from last July, the total number of tire companies, beginning in February of this year, the proportion of loss-making enterprises show a slight downward trend in August, the proportion of loss-making enterprises reproduction looked up, the overall loss for the state of the tire industry limited improvement. Analyze the reasons, we believe that is weaker than last year due to natural rubber overall this year, which makes the tire to lower the cost of doing business, but the weakness of the global consumer, a drag on corporate profits and income growth.
From the analysis of listed companies, S Jia Tong, Sailun shares, Qingdao Double Star and ST the Huanghai have a large scale semi-steel radial tire production capacity, and the capacity of the shares of Double Coin, Aeolus Luntai A, are basically all-steel meridian tires. Qingdao Doublestar semi-steel tire export markets, mainly in Europe and Southeast Asia. Semi-steel tire exports ratio Sailun shares of 90%, of which exports to the U.S. accounted for 30-40% of the first half of 2012, the company exported 4.09 million radial tires, total tire production ratio of 83.55%, semi-steel tire production was 3.85 million 78.62%, accounting for the proportion of tire production. The end of the special protective case makes semi-steel radial tire production capacity and exports were higher proportion of the company will be the main beneficiaries. Regain about 30 percent of the U.S. import market, according to our semi-steel tire corresponding to the passenger car / light truck tire increments of about 50 million, equivalent to 26% in 2011 China’s total exports of 193 million.
Figure 54: listed tire companies production in January-June 2012 (Unit: ten thousand)
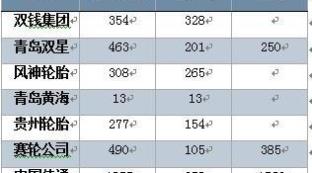
Figure 55: 2011 each listed tire companies the proportion of export earnings
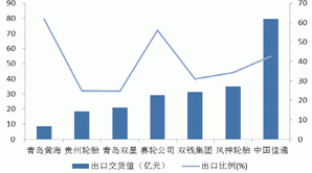
Source: WIND Securities Futures Research Department
Expectation, we believe that demand is the main driving force of the industry rebound limited influence of European labeling law.
Accompanied by the expiration of the tires safeguard, tire production certainly picked up momentum. Expected growth rate of 8%, China’s tire output of around 900 million in 2012, the tire export share of about 44%.
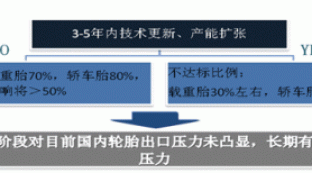
The export side, we believe that in 2013 after the United States stopped to impose special tariffs, domestic passenger car tires and light truck tire exports to the U.S. will be a significant growth. The European market, the implementation of the first phase of the labeling law, the extent of the impact of China’s tire exports, or less than 2% of the global perspective, labeling law fundamentally no qualitative impact of global consumption of natural rubber situation, such as the case of special protection as more psychologically investors have an impact, but has little effect on global supply and demand of natural rubber.
Figure 56: China’s truck and bus tire export market
Source: Research Department of the China Association of Automobile Manufacturers in the Futures
Figure 57: European label hair impact analysis Figure
Source: Securities Futures Research Department
5.2.2. Supporting tire with the tire replacement market analysis
Car tire market is divided into supporting tires, replacement tires two categories, global perspective, supporting tire and tire replacement market share averaged 25% and 75%, tire replacement is the main consumer market of the tire. Different models in different countries, two tire market share of different, in general, the developed countries with economies in replacement tire market share is higher than the replacement tire market share in emerging countries. Passenger cars and light trucks, for example, the proportion of tire replacement market of Europe and North America up to 79%, Asia only 56% of the tire replacement market; two areas of heavy truck tire replacement ratio is closer to 76% -78%.
Car to the U.S. market and the Chinese market data analysis, calculate the of supporting bilateral tires and tire replacement market developments.In general, cars have four matching tires, tire service life of 2-3 years; 4 matching tires light truck tire service life of 1 year; supporting medium-sized trucks 10 – tire, heavy duty trucks, 20 supporting tire, tires life is 1-2 years.
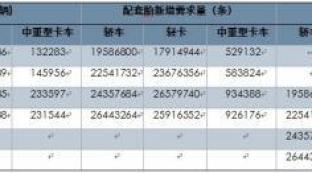
Automobile market in the United States, 2010-2012, the year-on-year increase of cars, light trucks, medium and heavy truck sales have different levels of growth, growth should be consistent with the growth of car sales, and the increase is slightly larger tire replacement. 2 years after a passenger car tire replacement, trucks replaced after 1 year, is expected to 2013, brought about by the new vehicles in 2009, passenger car replacement tire demand in about 24,350,000 new light truck and heavy-duty truck tire replacement needs were 25,910,000 and 9,260,000.
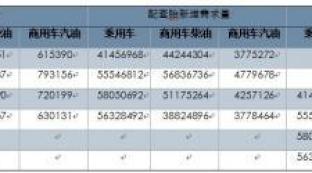
The increase in China’s auto market, passenger car, light truck sales (commercial gasoline vehicles) and heavy trucks (commercial diesel vehicles) a small peak in 2010, the late growth slowdown. Car tires be replaced after two years, replaced a year later trucks projections, expected in 2013, China will increase its passenger car tire replacement needs around 58,050,000, commercial vehicle tire replacement demand is about 76.6 million.
Figure 58: U.S. supporting tire with the tire replacement market
Source: WIND Securities Futures Research Department
Figure 59: supporting tire with the tire replacement market
Source: WIND Securities Futures Research Department
Translated by Google Translator from http://market.cria.org.cn/20/12122_4.html
Read more:
- 2013 natural rubber investment strategy report (part 1)
- 2013 natural rubber investment strategy report (part 2)
- 2013 natural rubber investment strategy report (part 3)
- 2013 natural rubber investment strategy report (part 5)


