5.3. Global Rubber Products Industry Analysis
5.3.1. World Rubber Products Market area pattern analysis
Global rubber products industry in Europe and the United States dominated the industry and a high degree of market concentration.
From the analysis of the geographical distribution, the very similar distribution pattern of the Global rubber products industry, and the pattern of the tire industry, Europe and the United States market share has remained at the level of 60-70%.
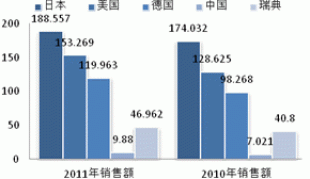
50 companies in 2011 before the global rubber products, non-tire rubber products business in Europe, Asia, North America enterprise revenue, respectively, accounted for 44.5%, 32% and 23.5% market share. Top five companies from Germany, France, Sweden and Japan, and Japan in the number of enterprises operating income are the largest non-tire rubber products operating income accounted for about 50 Total revenue 29%, followed by the United States, Germany income accounted for 23.5%, 18.4%.
Sweden despite only two companies short-listed, but its share of operating income there is 7.2%, showing that its not a small-scale. Contrast to the situation of the enterprise in China, China shortlisted companies also two, but its 2011 operating income of $ 988 million, accounting for only 1.5%. Little role in the global pattern of rubber products in China.
Figure 60: The number of global rubber products industry 50 companies ranked (units: a)
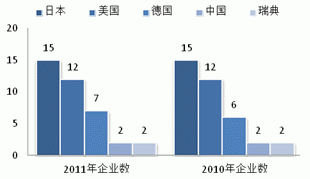
Figure 61: Global rubber products industry operating income of the top 50 rankings (Unit: 100 million U.S. dollars)
Source: China Rubber Futures Research Department of China Securities
5.3.2. Chinese rubber industry, the development of
The development of the rubber products industry showed extensive accelerated growth into the smooth development process.
Analysis from a number of firms, 1999 so far this year, the number of rubber enterprises into the fast-rising stage, initially Statistics 1436 companies rose to 4,861 in October 2011, a new high since 12 years of record. After 2011, the number of firms in a steep drop, to September 2012, the decline has reached 42.6%.
Analysis, in October 2009, with the growth of the rubber products businesses, the proportion of loss-making enterprises is gradually reduced from the economies of scale, indicating that the rubber products to the overall progress of the industry to get the amount of extensive development.2011, the form of the change, the sudden drop in the number of rubber products enterprise, while the rate of decline of the number of loss-making enterprises more extensive development stage than there have been more substantial reduction, indicating that the optimal adjustment of the rubber industry, the internal ongoing industry bodies More small-scale enterprises to withdraw from the market losses.
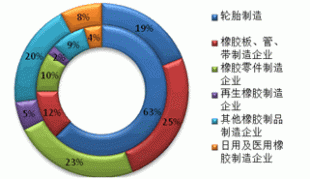
Analysis of the distribution of sub-sectors, rubber sheet, tube, with manufacturing companies, rubber parts manufacturing companies, tire manufacturing companies among the top three, respectively, accounting for 25%, 23% and 19%. The three operating income accounted for 62.5%, 12.4% and 9.8%, respectively. Visible number of tire companies in small quantities, but they occupy half of the operating income contribution of the entire industry, rubber sheet, tube, with manufacturers and rubber parts manufacturing enterprises, the number of the upper hand, but the overall small-scale.
Figure 62: China’s rubber industry, the number of enterprises (units: a,%)
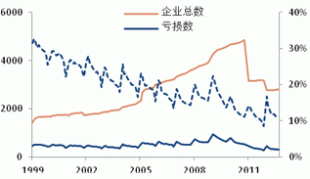
Figure 63: The distribution of rubber products, the number of firms and operating income (unit:%)
Source: WIND Securities Futures Research Department
6. Synthetic rubber industry review and outlook
6.1. Global Synthetic Rubber Industry Analysis
From the present situation, the global synthetic rubber supply and demand remain balanced. Global synthetic rubber in 2011 total production capacity of 15.6 million tons / year, the total consumption of 14.54 million tons / year.
From the regional distribution, global synthetic rubber supply and consumption are mainly concentrated in the Asia-Pacific, Europe and North America.
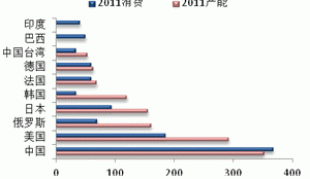
The Asia-Pacific region accounted for the largest supply and demand in 2011 accounted for 46.1% and 50.9% in 2005 to 2011 the average annual growth rate of the production capacity in the Asia-Pacific region and demand were 7.1%, 7.3%. Little change in capacity in Europe and North America, and demand for the negative growth. From specific countries, China is the world’s synthetic rubber production capacity, consumption superpower.Domestic energy consumption in 2011 were 3.52 million tons and 3.68 million tons, accounting for 22.6% and 26.8% global share. Followed by the United States, the production capacity is much larger than the consumption.Production capacity in China and the United States, total consumption accounted for 41.4% and 40% of the global total. In addition, Brazil, and India is a net consumer of.
Figure 64: The distribution of 2011 synthetic rubber production capacity, consumption areas (unit: million tons)
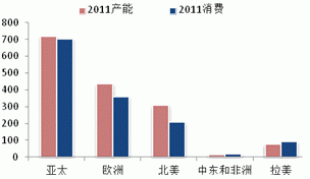
Figure 65: 2011 syntheic capacity, consumer countries distribution (unit: million tons)
Source: Sinopec in the Futures Research Department
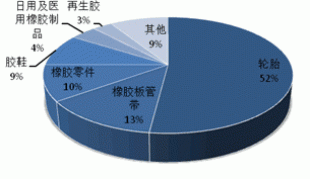
From downstream consumption structure, the largest tire consumption of the total consumption ratio.
Tire consumption, the proportion of the total consumption of about 52%; followed by tape, plastic sheet, hose, accounting for approximately 13%; rubber parts and rubber shoes, accounting for 10% and 9%, respectively, daily and medical rubber accounted for 4 % recycled rubber accounted for 3%.
Figure 66: syntheic the downstream consumption structure
Source: Securities Futures Research Department
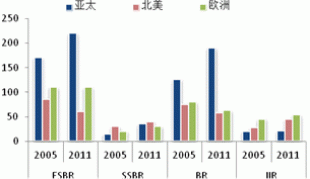
Figure 67: synthetic rubber varieties regional capacity change (Unit: million tons / year)
Source: Sinopec in the Futures Research Department
The tire major varieties of synthetic rubber, styrene-butadiene rubber and butadiene rubber largest proportion.
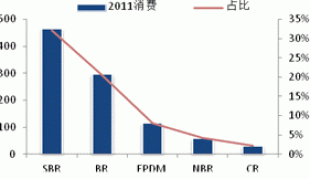
Tire types of plastic styrene butadiene rubber SBR and polybutadiene rubber BR, butyl rubber IIR, the production of isoprene rubber IR and consumption accounted for 70.3% and 65% of the total. SBR styrene-butadiene rubber and polybutadiene rubber BR is a major consumer of varieties, respectively, of the total consumption of 32.1% and 20.5%.
Tire demand preference is a direct result of the expansion of the production capacity of the corresponding varieties of synthetic rubber.Reflected in the 2005-2011 year, the Asia-Pacific region emulsion polymerized styrene-butadiene rubber ESBR butadiene rubber BR production increased significantly, while North America ESBR and BR capacity shrinking, little change European region ESBR capacity, BR decreasing trend.
Figure 68: 2011 Global synthetic rubber varieties produced. Distribution (Unit: million tons / year)
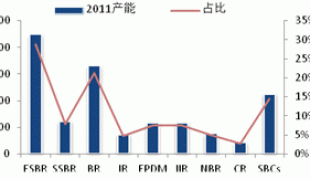
Figure 69: the 2011 Global syntheic sub-varieties of consumer distribution (unit: million tons / year)
Source: Sinopec in the Futures Research Department
Looking ahead, the solution polymerized styrene-butadiene rubber SSBR and Nd-butadiene rubber is a new trend of the future development and production capacity are concentrated in Asia.
Tire production process to improve, so the tire production formula changes will drive the use of synthetic rubber, synthetic rubber, industrial production structure adjustment. Two prominent trend, namely:
A solution polymerized styrene-butadiene rubber SSBR alternative emulsion polymerized SBR ESBR, the former can effectively improve the tire wet skid resistance, and can directly replace existing production formula ESBR enterprise replacement formula lower cost.
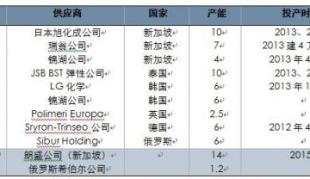
Second, neodymium the butadiene rubber Nd-BR alternative cobalt Department, nickel butadiene rubber, the former is a very good performance in wear resistance, resistance to aging and to reduce rolling resistance, and the recipe can also be a direct replacement for the latter . In addition, the capacity of the three regions in the Asia-Pacific, North America and Europe, solution polymerized styrene-butadiene rubber the SSBR and butyl rubber IIR showed an upward trend. Global solution polymerized styrene-butadiene rubber production capacity will reach 2.149 million tons / year, while new capacity is mainly concentrated in the Asian region.
Figure 70: International market SSBR and Nd-butadiene rubber expansion plan (Unit: million tons / year)
Source: Sinopec in the Futures Research Department
6.2. China Synthetic Rubber Industry
Developments, the synthetic rubber industry in China started late, but the rapid pace of development.
2003, China’s synthetic rubber consumption amounted to the world’s first, the 2009 syntheic production of the first in the world. In 2011, China’s major synthetic rubber mounted Ge total capacity reached 3.33 million tons, including 520,000 tons of new capacity, year-on-year growth of 18.5%. Production and sales still maintaining the world.
Sub-varieties, the production capacity more varieties for BR butadiene rubber, incremental total increment of 30%, followed by SBR SBR incremental accounted for 20%, in addition Butyl rubber IIR and isoprene The diene rubber IR growth accounted for 14.5%, 14%, respectively.
Figure 71: domestic synthetic rubber production capacity of all varieties change (Unit: million tons / year)
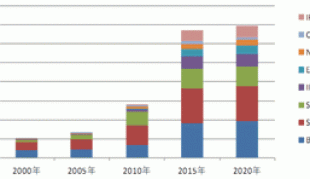
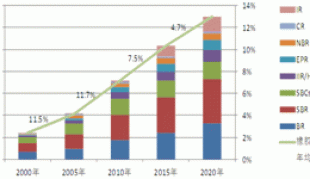
Figure 72: domestic synthetic rubber demand changes (Unit: million tons / year)
Source: Sinopec in the Futures Research Department
Demand 2000 to 2010, China’s synthetic rubber demand growth of about 10%. Expected to synthetic rubber demand in 2015 will reach 520 million tons, with an average annual growth of 6% to 7%, the growth rate has slowed down significantly. Rapid growth of styrene butadiene rubber SBR, cis butadiene rubber BR, IR isoprene rubber, butyl rubber, IIR, ethylene-propylene rubber EPDM, up to 30%, 20%, 28%, 9% and 8%, respectively. Simple calculation of the balance of supply and demand = capacity – demand “, it is expected that the domestic supply of synthetic rubber in 2015 a large number of surplus, device utilization will drop. This situation eased in 2020, but it is still not optimistic, there is still excess supply of most varieties, the structural contradictions of product supply and demand will continue to exist.
Figure 73: domestic synthetic rubber supply and demand peaceful status quo (Unit: million tons)
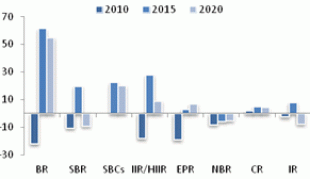
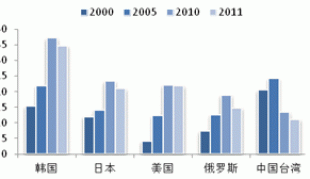
Figure 74: China’s synthetic rubber imports sources (unit: million tons)
Source: Sinopec in the Futures Research Department
Source of imports, China’s synthetic rubber imports from neighboring countries and regions, the product mainly to Universal. I the beginning of 2006, South Korea has become the largest source of imports of synthetic rubber, styrene-butadiene rubber and butadiene rubber accounted for more than 60% of the total imports from Korea. China’s imports from the United States places high value-added products accounted for 66% of total imports, 2011 butyl rubber and ethylene propylene rubber. Imports from the U.S. in 2011, unchanged from the previous year, the volume of imports from other countries declined.
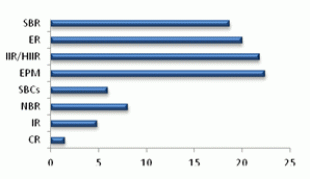
Total imports in 2006, China’s synthetic rubber imports exceeded 100 million tons in 2010 hit a record high of 1.39 million tons. The average annual growth rate of 11.7% in 2000-2010. The decrease in imports in 2011, we believe that this is mainly by the demand slowdown in growth and a substantial increase in domestic production. Butadiene-styrene, butadiene, butyl and ethylene-propylene rubber is the main varieties of domestic imports accounted for nearly 70% of total imports in 2011. Net imports of varieties are butadiene-styrene, butadiene, butyl, and ethylene-propylene rubber-based.
Figure 75: China’s synthetic rubber imports (Unit: million tons)
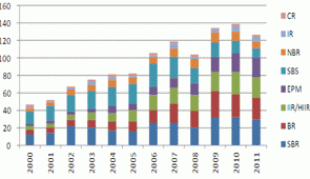
Figure 76: 2011 varieties of synthetic rubber net imports (Unit: million tons)
Source: WIND Securities Futures Research Department
Looking ahead, we believe that with the expansion of demand solution polymerized styrene-butadiene rubber and neodymium polybutadiene rubber, solution polymerized styrene-butadiene rubber and neodymium butadiene rubber capacity lower case, expected future – In three years, China’s imports of solution polymerized styrene-butadiene rubber and neodymium polybutadiene rubber will increase more than other synthetic rubber varieties.
7. Natural rubber market in 2013 outlook
Formed in the pressure of macroeconomic fundamentals dual weak financial attributes and product attributes resonance in 2012, which dragged down the natural rubber interpretation of the fifth wave of the downtrend, but in the fourth quarter, the economy has stabilized and slightly easing the pressure makes financial attributes plus industrial policy face with basically completed a bottoming process. We expect 2013 background of recovery in the economy and the fundamentals are weak, the trend of natural rubber or slightly better performance in 2012, showing a modest recovery may be larger.
Industry based on the front natural rubber supply and demand analysis, combined with the macro side, the positive factors can be expected in 2013:
First of all, the domestic macroeconomic maintain stabilized after a moderate recovery; continued slow recovery of the U.S. economy; European economy has shown a positive signal, dragged or will weaken, although the financial crisis is still not over, but the worst period of the second wave of shock basic past, so the macro surface to maintain neutral.
Secondly, China has turned on the pace of the secondary reform, urbanization, and plans to expand domestic demand may boost auto consumption force, which corresponds to the consumer continues to improve the positive significance.
In addition, China and the U.S. auto industry is expected to maintain the restorative rebound, there are varying degrees of improvement in the automotive industry in other countries emerging body; biggest drag on the European market is expected to gradually stabilized possible.
However, in 2013 the risk factors still exist:
First of all, the efforts to improve the global economy is still limited, but also makes the consumer end of the warmer and more moderate, high inventory digestion will be slower, to suppress the formation of natural rubber prices rebound;
Secondly, the supply has entered the peak cycle, excluding the impact of unexpected weather, if there is no policy intervention, output is expected to remain high;
In addition, the world has entered the era of green tires, technical barriers or the tire industry integration as inevitable, or increase the industry reshuffle;
Moreover, alternative markets to accelerate the development of medium-and long-term natural rubber consumption, which is also a threat exists.
Comprehensive analysis of the natural rubber market in 2013 destined to calm financial attributes and product attributes will be interwoven influence the market. However, from the long and short elements expected global weak recovery and reform is expected to become China’s largest market concerns, will likely moderate to dilute the negative pressure. Therefore, we believe that environmental improvement or driven by natural rubber fundamentals to form weak recovery situation, the price of natural rubber in after of Shenfudiaozheng nearly two years after the bottom of the basic uncertain, late moderate probability of recovery is expected beneath 22000-23000 yuan strong support, while the Annex resistance above 29,000 yuan will also be obvious.
Translated by Google Translator from http://market.cria.org.cn/20/12122_5.html
Read more:
- 2013 natural rubber investment strategy report (part 1)
- 2013 natural rubber investment strategy report (part 2)
- 2013 natural rubber investment strategy report (part 3)
- 2013 natural rubber investment strategy report (part 4)


