Some analysts believe this October could be less volatile than expected
Upcoming week filled with high-profile earnings releases
Tesla shares currently behaving like traditional, value stock automobile companies
Earnings releases from some of the US’s largest companies are likely to be financial market catalysts next week when an array of businesses from a variety of sectors provide their quarterly results. Note, too, the term ‘catalyst’ could be misleading. It would suggest that stocks were languishing and in need of an additional push.
That’s hardly the case. Currently an assortment of stocks have been providing significant returns.
What happened to the scariest month of the year for markets?
At the beginning of the month, we cautioned that October was notorious for being the most volatile month of the year, by far. That statistic is true for every October in general, but during a year in which inflation and tightening were already weighing on markets, we figured market action might just get inordinately wild.
We published our warning following the first monthly decline for US stocks in eight months, and the worst monthly drop since the infamous March 2020 bottom. However, so far in October stocks are chugging along just fine.
Three of the four major US equity indices—the S&P 500, the Dow Jones, and the NASDAQ (both the Composite and NASDAQ 100)—posted gains two weeks in a row during October. Plus, the mega-cap Dow is on course for its best month since March and its most profitable October in six years.
Perhaps we were overly alarmist and investors will safely be able to avert losses during what amounts to the scariest month of the year for markets. And maybe they’ll even be able to enter November with gains.
That seems to be Jim Cramer’s view. During a recent Mad Money segment he characterized the upcoming corporate earnings as the “the cavalry’s finally here to save the day.” In his view, corporate results are not necessarily all going to be positive, but they’ll provide a needed upside distraction so investors will no longer be worried about inflation and tightening.
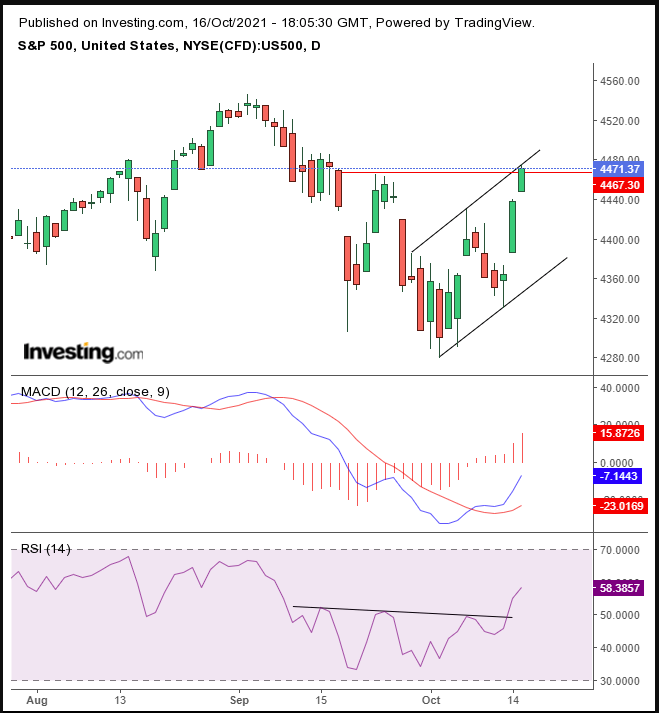
It’s certainly a comforting thought, but we’re not convinced. Here’ what we’re seeing on the S&P 500 chart:
 SPX Daily
While we acknowledge that trading developed a solid weekly candle, the first two trading days of this past week extended the previous Friday’s selloff, which occurred after the volatile session on the preceding Thursday. Though the broad benchmark opened considerably higher last Monday, it closed well off its highs, forming a Shooting Star—a cue for technical analysts to get out, before the three-day decline. This is what volatility looks like.
Also, the index closed this past Friday at the top of the raising channel, where it meets with the resistance formed from Sept. 23 through 27, increasing the odds of a pullback when trading opens on Monday. Note, however, the daily RSI completed a H&S bottom, and the MACD triggered a buy signal.
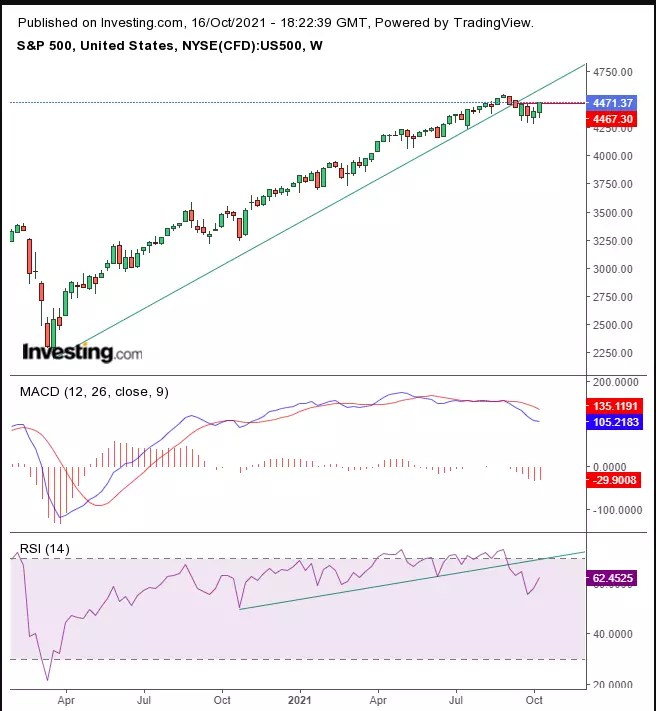
As such, we can see conflict between the indicators and the presumed resistance of the rising channel, compounded by the previous high. That could be the technical set-up for volatility. The weekly chart provides additional reasons to be cautious:
 SPX Weekly
Via a longer perspective, it’s obvious the S&P 500 fell below its long-term uptrend line since that March 2020 bottom referred to above. Also, the same indicators that were bullish on the daily chart are clearly bearish on the weekly view—more evidence for potential volatility.
Finally, we’ve pointed out repeatedly in previous posts during the period depicted above, a variety of market anomalies and contradictions. For example, the market narrative dictated that stocks were selling off because investors were worried about inflation, yet futures on the small-cap Russell 2000 outperformed contracts on the tech-heavy NASDAQ 100 by a factor of 2:1.
The small-cap index has been the poster child for value stocks in a post-pandemic world. When investors believed the economy was set to restart, they bid up domestic stocks. When they thought the COVID outbreak would continue to persist, they sold off small-caps and value sectors, rerouting capital to technology shares, the so-called pandemic darlings.
Why, then, were Russell futures outperforming, while NASDAQ contracts lagged, when investors were concerned that inflation will upend the delicate economic recovery?
 RUT Weekly
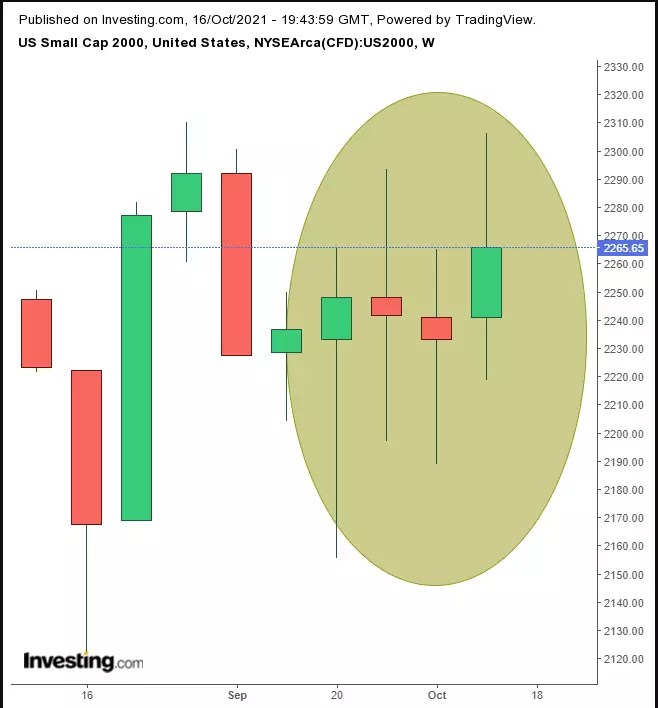
The Russell 2000, was, in fact, volatile, along with the S&P 500 at the beginning of last week’s trading. Plus, as opposed to peer indices that rose during the two weeks of October trading, the Russell 2000 only saw a single week’s advance. As well, the small-cap index has been flying high and dropping low, only to ultimately close near its weekly opening level for five straight weeks.
Such a pattern illustrates a loss of direction; given the Russell 2000 could be considered a proxy for investor outlook on the economic recovery, this might mean something. Thus, in our estimation it isn’t a fair assessment to say that markets have been calm, as some financial outlets have claimed. Nor is it a foregone conclusion that earnings will prove to be the “cavalry” that takes stocks higher, as Jim Cramer says.
Still, whether stocks surge or become more volatile, they could offer a target-rich environment for traders. Among the dozens of companies scheduled to release results during the coming week, reports from such popular stocks as Netflix (NASDAQ:NFLX), Tesla (NASDAQ:TSLA), and Intel (NASDAQ:INTC) are due, along with releases from such blue chip companies as Procter & Gamble (NYSE:PG), which reports before the open on Tuesday, Oct. 19, and American Express (NYSE:AXP) which releases earnings on Friday, Oct. 22, before the open as well.
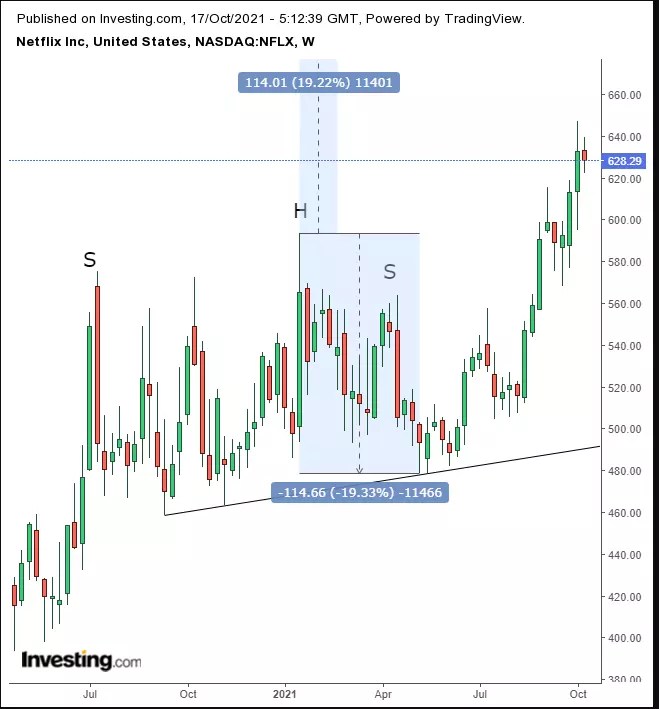
Netflix, which is scheduled to report earnings on Tuesday, Oct. 19, after the close, recently blew out a H&S top, putting the $700 level in sight.
 NFLX Weekly
The streaming entertainment giant outperformed when people were stuck at home during lockdowns. Could this mean investors don’t see the economy restarting in the medium-term?
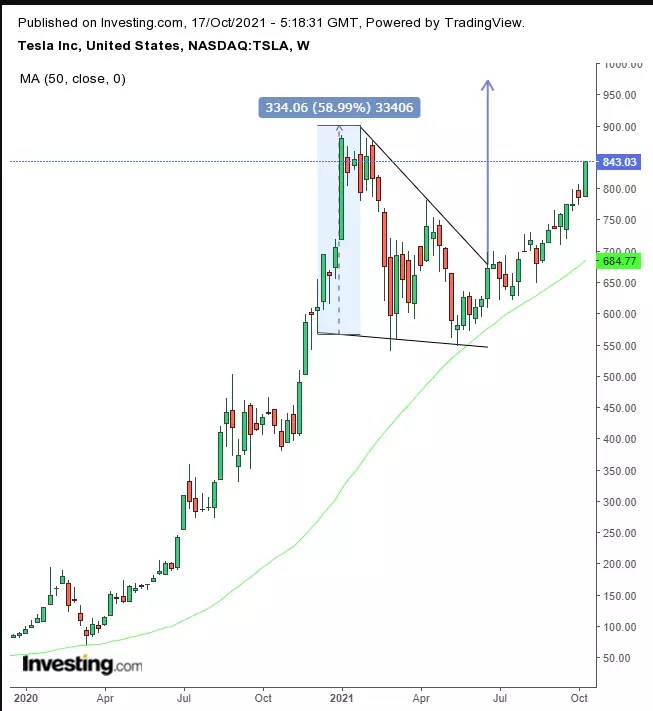
Electric vehicle-maker Tesla, which reports on Wednesday, Oct. 20, after the close, recently completed a bearish wedge, which could propel its share price to the $1,000 mark.
 TSLA Weekly
TSLA’s bullish pattern is surprising. The expectation for rising yields would generally pressure tech companies, including this one, as the expectation of higher rates reduces the value of Tesla’s future earnings. Indeed giant tech companies are generally categorized as growth stocks, yet TSLA is acting like a value stock, just like any other car company. This could be due to investors have high hopes for Tesla earnings this week.
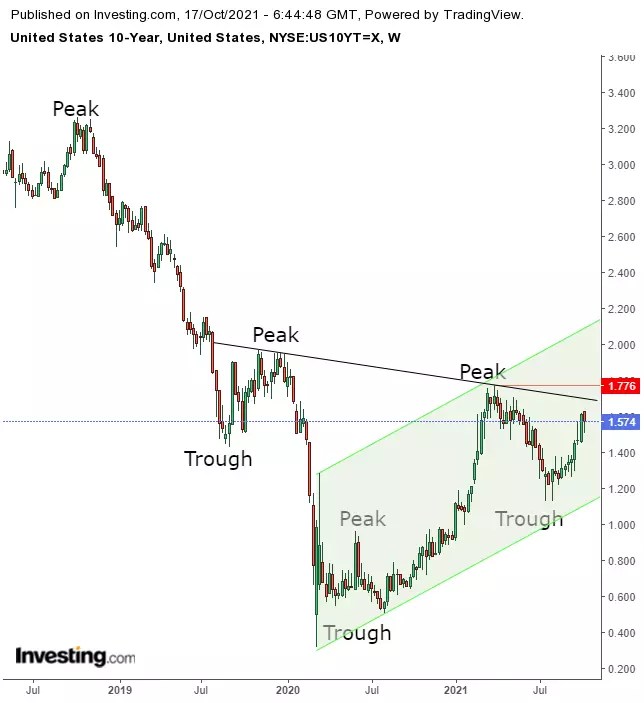
Treasury yields, including for the 10-year benchmark note, fell last week, for the first time in eight weeks.
 UST 10Y Weekly
Rates are caught between the extension of a fledgling uptrend and what conservative investors may still consider to be a broader downtrend. That’s because rates didn’t yet post two rising peaks and troughs, independent of the highs and lows within the downtrend. Therefore, the 1.1776% level is key in determining whether rates have bottomed. Note that the trading activity described is that of a H&S bottom.
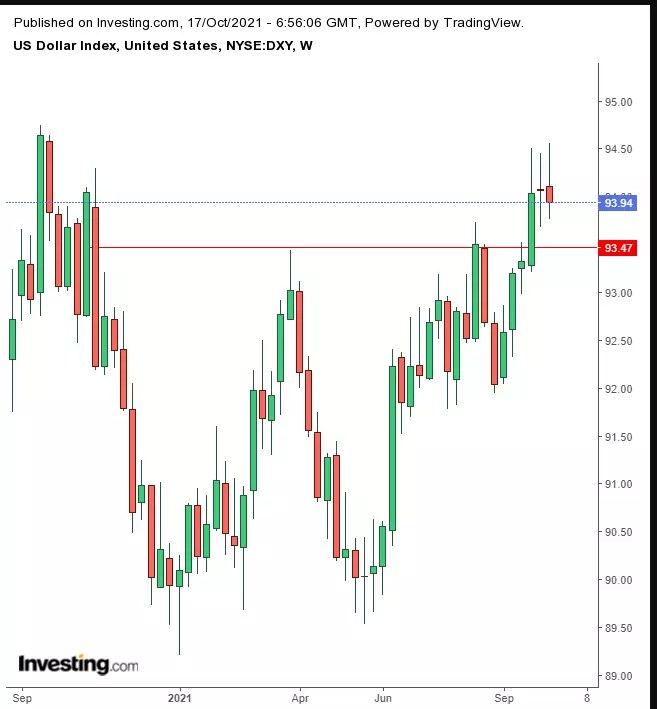
The dollar declined, extending volatility for a third week.
 Dollar Weekly
This occurred after the greenback completed a massive double bottom since its January low.
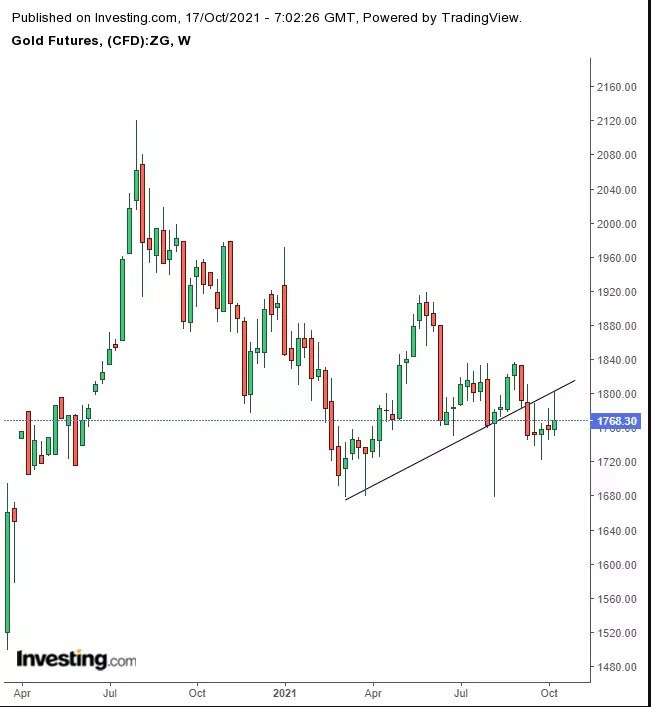
Gold fell hard on Friday, despite dollar weakness, on rising yields.
 Gold Weekly
The yellow metal retested what could be a weekly H&S continuation pattern.
Bitcoin has surged for three straight weeks.
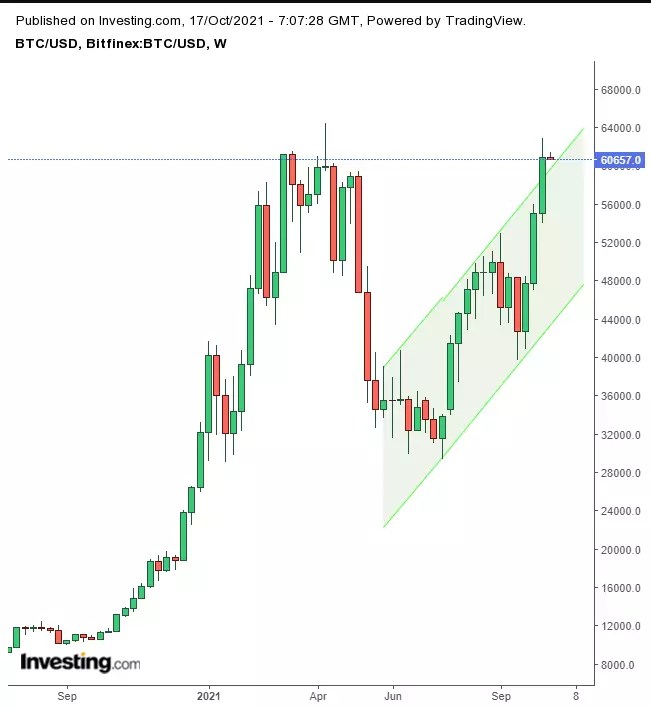 BTC/USD Weekly
The crypto’s price activity over the past three weeks produced a bullish candlestick pattern dubbed, Three White Soldiers. This could be followed by a dip, even if the uptrend then resumes. That would be understandable considering the price of the digital token stopped below its April record.
Oil crossed the $82 level for the first time since 2014 amid a global oil crunch, pushing WTI to its eighth straight weekly gain, the commodity’s longest weekly bull run since 2015.
The Week Ahead
All times listed are EDT
Sunday
22:00: China – Q3 GDP: seen to drop to 5.2% from 7.9% YoY.
22:00: China – Industrial Production: expected to decline to 4.5% from 5.3% YoY.
Monday
9:15: US – Industrial Production: anticipated to have slipped to 0.2% in September from 0.4% previously.
21:30: Australia – RBA Meeting Minutes
Tuesday
8:05: UK – BoE Governor Bailey Speaks
8:30: US – Building Permits: forecast to have dipped to 1.680M from 1.721M.
21:30: China – PBoC Loan Prime Rate: previously set at 3.85%.
Wednesday
2:00: UK – CPI: likely to have remained flat at 3.2% YoY.
5:00: Eurozone – CPI: presumed to have stayed at 3.4% YoY in September.
8:30: Canada – Core CPI: last month’s reading printed at 0.2% YoY.
10:30: US – Crude Oil Inventories: expected to rise to 0.702M from 6.088M.
Thursday
8:30: US – Initial Jobless Claims: predicted to edge up to 303K from 293K.
8:30: US – Philadelphia Fed Manufacturing Index: forecast to fall to 24.5 from 30.7.
10:00: US – Existing Home Sales: seen to climb to 6.06M from 5.88M.
Friday
2:00: UK – Retail Sales: anticipated to surge to 0.4% from -0.9%.
3:30: Germany – Manufacturing PMI: to edge lower, to 56.9 from 58.4.
8:30: Canada – Core Retail Sales: forecast to soar to 3.0% from -1.0%.
Source: Investing.com


