2012 third quarter, industry current prices of industrial output value and sales revenue to achieve only modest growth, continue to increase in a narrowing trend, export growth continued to show a downward trend, the efficiency of the sector conditions continue to maintain good posture.
I. 2012 first three quarters of the industry run the main condition
According to the tire, cycle tire, hose tape, rubber products, rubber boots, latex, carbon black, rubber and comprehensive utilization, machinery and molds, rubber additives, skeleton material 11 clubs in 430 key statistics of member companies, the completion of the first three quarters of the current price The industrial output value of 234.6 billion yuan, a year-on-year growth of 2.62%; sales income of 233.526 billion yuan, a year-on-year growth of 1.97%; export delivery value of 69.773 billion yuan, a year-on-year growth of 3.54%. 362 key enterprises loss of $ 552 million (excluding additives, skeleton), 16.53 billion yuan in profits and taxes, an increase of 26.32%, a profit of 10.316 billion yuan, a year-on-year growth of 31.56%; 53 loss, loss of 14.64%; yuan, a year-on-year decrease of 14.77%. The Association 2012 third quarter of the industry and the professional current prices of industrial output growth situation shown in Figure 1 Figure 2,2012 rubber industry indicators year on year growth trend status in 2012 and the third quarter of 2011 the main indicators of the rubber industry increase compared situation see Figure 3.
Figure 1: 2012 the first three quarters of Association statistics industry and various specialized industrial output growth conditions
Figure 2:2012 increase compared with the 2011 first three quarters of the rubber industry key indicators status
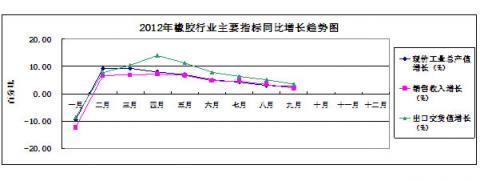
Figure 3:2012 main indicators of the rubber industry trend of an increase situation
1 . Tire
Wheel tire 44 major member companies in 2012, with three quarters of 2011 the tire main indicators increase contrast situation shown in Figure 4,2012 tire main indicators year-on-year growth trend status as shown in Figure 5.
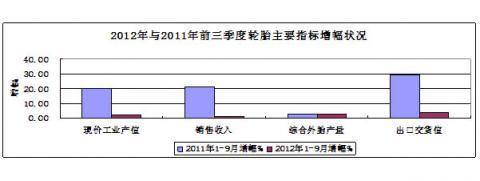
Figure 4:2012 main indicators with three quarters of 2011 tires increase compared situation.
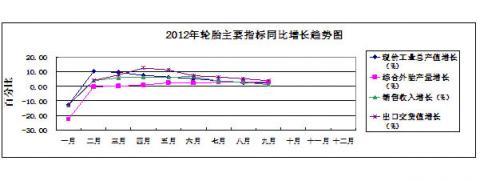
Figure 5:2012 tire main indicators year on year growth trend status
Completion of the third quarter of 2012, industrial output at current prices grew 2.39%, to achieve sales revenue year-on-year increase of 1.01%; the integrated tire production grew by 2.95%, radial tire production increased by 3.33%, all-steel radial tire production increased by 4.01% ; meridian The rate of 87.44 percent, an increase of 0.32 percentage points compared with the same period last year . An export value of year-on-year growth of 3.76%; export rate (value) of 34.9%, an increase of 0.46 percentage points compared with the same period last year. Export tire deliveries increased by 1.99 percent year-on-year, to export radial tires a year-on-year increase of 0.57%; export rate (amount) of 43.48%, a decrease of 0.41 percentage points compared with the same period last year.
2. Cycle tire
Cycle tire 38 key enterprises in 2012 and 2011 years ago, three quarters of cycle tire indicators increase compared situation shown in Figure 6,2012 years main indicators of year-on-year growth trend cycle tire situation shown in Figure 7.
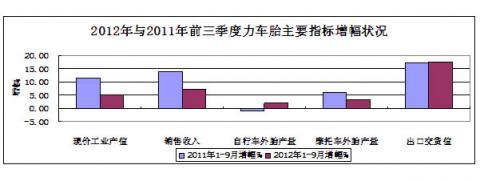
Figure 6:2012 cycle tire with the first three quarters of 2011, the main indicators increase compared situation
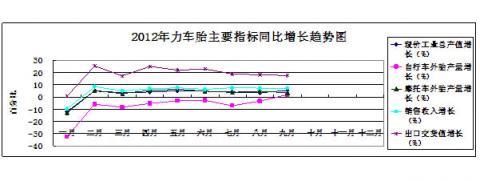
Figure 7:2012 year cycle tire main index year-on-year growth trend status
Completed in the third quarter of 2012 to the current price of industrial output up 5.19%, sales revenue grew by 7.2%; bicycle tire production increased by 1.99% leading products, motorcycle tire production increased by 3.37%, electric bicycle tire production grew by 0.2 %. Export delivery value year-on-year growth of 17.61%; export rate (value) of 23.23%, an increase of 2.45 percentage points.
3 . Hose tape
Hose tape 50 key enterprises of the industry in 2012 and the 2011 first three quarters of the main indicators of the hose tape increase compared situation shown in Figure 8,2012 hose tape indicators year-on-year growth trend status as shown in Figure 9.
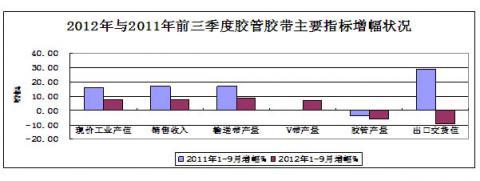
Figure 8:2012 hose tape and the first three quarters of 2011 the main indicators increase compared situation
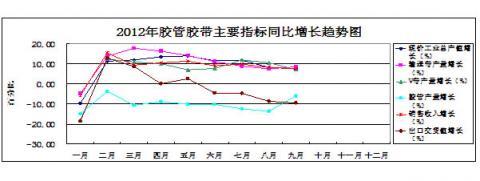
Figure 9:2012 hose tape index year-on-year growth trend status
Completed in the third quarter of 2012 to the current price of industrial output up 7.6%, 7.53% year-on-year growth in sales revenue; conveyor belt production of major products, an increase of 8.58%, V-belt production increased by 7.19%, Hose yield fell to 6.03%. Export delivery value fell 9.49%; export rate (value) of 11.91%,compared with the same period last year, a decrease of 2.25 percentage points.
4 . Products
56 key enterprises of rubber products in 2012 and the 2011 first three quarters of the main indicators of the rubber products increase compared situation shown in Figure 10,2012 products main indicators year on year growth trend status as shown in Figure 11.
The current price of industrial output fell 5.98%, sales revenue fell 2.8% in the first three quarters of 2012; major products “O”-ring fell 28.14%, automobile damping products fell 36.02%. Export delivery value year-on-year growth of 11.47%; export rate (value) of 22.36%, an increase of 3.5 percentage points compared with the same period last year; exports of auto parts fell by 16.91%.
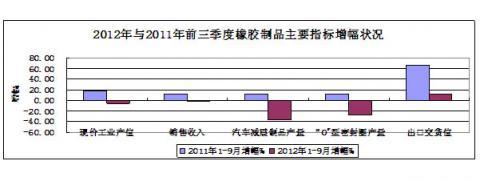
Figure 10:2012 condition of the main indicators increase compared with the first three quarters of 2011, rubber products
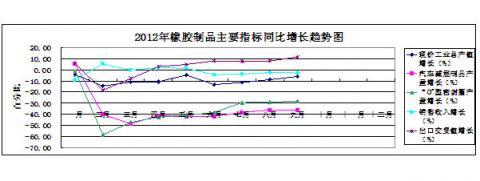
Figure 11:2012 products main indicators of year-on-year growth trend status
5 . Latex
Latex 29 key enterprises in 2012 and the third quarter 2011 the latex main indicators increase compared situation shown in Figure 12,2012 latex main indicators of year-on-year growth trend situation shown in Figure 13.
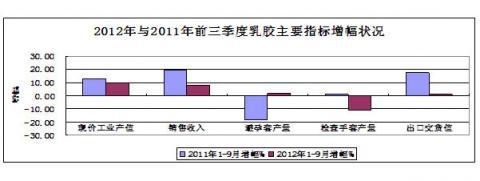
Figure 12:2012 year the latex main indicators, the first three quarters of 2011, an increase of contrast situation.
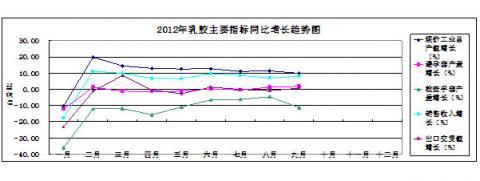
Figure 13:2012 latex main indicators year on year growth trend status
Achieve the current prices of industrial output in the third quarter of 2012, year-on-year growth of 9.97%, the completion of the sales revenue year-on-year growth of 8.05%; major product condoms a year-on-year increase of 1.86%, medical gloves, an increase of 6.82 percent, and examination gloves down 11.29%. Export delivery value year-on-year growth of 0.73%; export rate of 46.93% (value), reduced by 4.31 percentage points compared with the same period last year.
6 . Rubber shoes
Rubber shoes 31 key enterprises in 2012 and the 2011 first three quarters of the galoshes main indicators increase compared situation shown in Figure 14,2012 galoshes main indicators year on year growth trend status as shown in Figure 15.
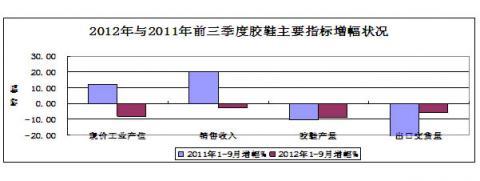
Figure 14:2012 years main indicators increase compared with the first three quarters of 2011, galoshes situation
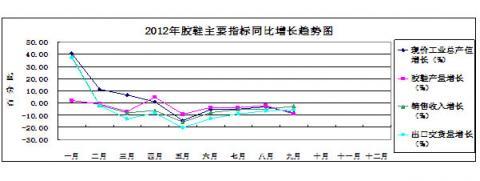
Figure 15:2012 the galoshes main indicators year on year growth trend status
The completion of the third quarter of 2012, the current price of industrial output fell 8.22%, down 2.67% year-on-year sales revenue; complete the galoshes production down 8.93%. Export delivery value year-on-year growth of 3.99%; export rate (value) of 6.64%, an increase of 0.43 percentage points compared with the same period last year; to export rubber shoes fell 5.73%; export rate (amount) of 8.11%, an increase of 0.27 percentage points.
7 . Carbon black
Carbon black 36 key enterprises in 2012 and the 2011 first three quarters of the increase in carbon black key indicators contrast situation shown in Figure 16,2012 carbon black major indicators year on year growth trend status as shown in Figure 17.
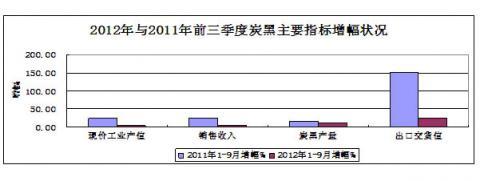
Figure 16:2012 carbon black major indicators of the first three quarters of 2011, an increase compared situation.
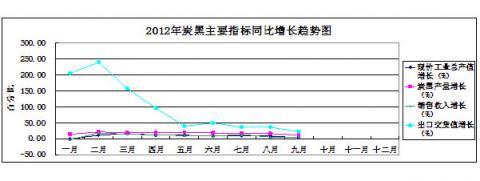
Figure 17:2012 carbon black main indicators of year-on-year growth trend status
Completed in the third quarter of 2012 year-on-year growth of 3.77% to the current prices of industrial output, sales revenue grew 3.92%; carbon black total output year-on-year growth of 11.65%, which wet carbon black production increased by 13.29%. Export delivery value year-on-year growth of 22.9%; export rate (value) of 17.2%, an increase of 2.68 percentage points compared with the same period last year; exports up 38.64% carbon black, the export rate (amount) of 16.62% with the same period last year, an increase of 3.24 percentage points.
8 . Waste rubber utilization
Waste rubber 51 key enterprises in 2012 and the first three quarters of 2011, waste rubber comprehensive utilization of key indicators increase compared situation shown in Figure 18,2012 years mainly comprehensive utilization of waste rubber index year-on-year growth trend situation shown in Figure 19.
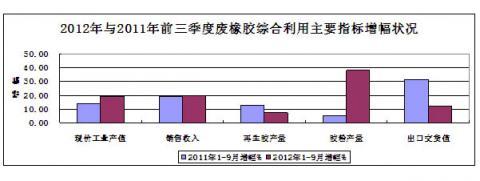
Figure 18:2012 comprehensive utilization of waste rubber and the first three quarters of 2011 the main indicators increase compared situation
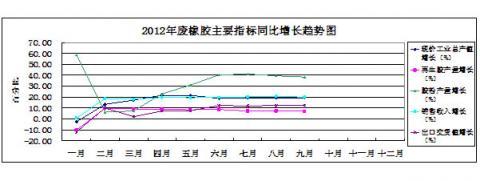
Figure 19:2012 waste rubber comprehensive utilization of the main indicators of year-on-year growth trend status
The current prices of industrial output in the third quarter of 2012, an increase of 19.23 percent year-on-year , sales revenue grew 19.98%. An increase of 7.02%, the production of reclaimed rubber powder production increased by 38.27%. Export delivery value; export rate (value) of 5.0% year-on-year growth of 12.28%, a decrease of 0.31 percentage points compared with the same period last year.
9 . Machinery mold
Mechanical mold 26 key enterprises in 2012 and 2011 the main indicators of the first three quarters of mold increase compared situation shown in Figure 20,2012 mold main indicators year on year growth trend status as shown in Figure 21.
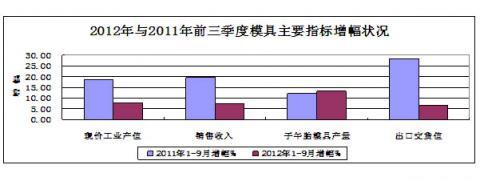
Figure 20:2012 mold with the first three quarters of 2011, the main indicators increase compared situation
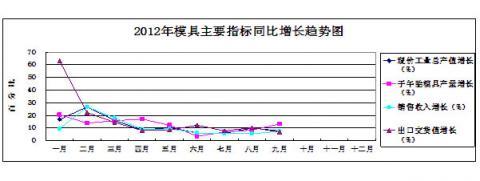
Figure 21:2012 mold year-on-year growth trend status of key indicators
Achieve the current prices of industrial output in the third quarter of 2012, a year-on-year growth of 7.69%, sales revenue grew 7.26%; complete radial tire mold production increased by 13.15%. Export delivery value of year-on-year growth of 6.86%; export rate (value) of 14.4%, compared with the same period last year decreased by 0.05 percentage points.
10 . Rubber additives
Rubber chemicals 45 key enterprises in 2012 and 2011 the first three quarters of the main indicators of the rubber chemicals increase compared situation shown in Figure 22, the main indicators of the rubber chemicals in 2012 year-on-year growth trend in the situation shown in Figure 23.
The completion of the third quarter of 2012, the industrial output value a year-on-year increase of 4.33%, to completed sales revenue grew by 2.15%. The rubber chemicals production growth of 24.94 percent year-on-year; accelerator production of major products decreased by 0.66% year-on-year, the antioxidant production grew 11.83%.Export delivery value fell by 14.84% and 32.92% of the export rate (value), down 6.57 percent; export rubber chemicals a year-on-year growth of 19.34%; export rate (amount) of 29.66%, down 1.39 percentage points.
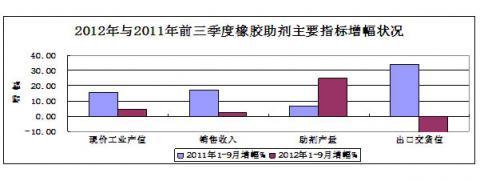
Figure 22:2012 rubber additives and the first three quarters of 2011, the main indicators increase contrast situation.
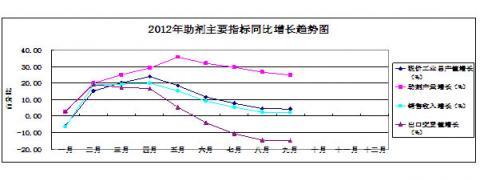
Figure 23:2012 main indicators of rubber chemicals a year-on-year growth trend status
11 . The skeleton material
Skeleton materials glue 23 key enterprises in the third quarter of 2012, production of skeleton material a total of 1.761 million tons, including 273,000 tons of fiber tire cord fabric, a year-on-year growth of 10.98%; 1.078 million tons of steel cord, a year-on-year growth of 10.79%; 410,000 bead wire tons, a year-on-year growth of 9.33%.
II. The market conditions in the first three quarters 2012
1. Tire sales price situation
According to the market truck radial tire (12.00R20-18PR, 11.00R20-16PR, 12R22.5-16PR, 8.25R16-16PR) and four kinds of passenger car radial tires (215/55R16, 205/55R16, 195/55R15 165/70R14) retail price monitoring, anchored (to January 2011, the price index of 100), the calculation of September 2012, the price index of steel radial 101.03, down 0.42 basis points from the previous month; semi-steel radial passenger tire The index was 100.99, last month fell 0.45 basis points.
Truck tires and passenger car tire price index trend is shown in Figure 24.
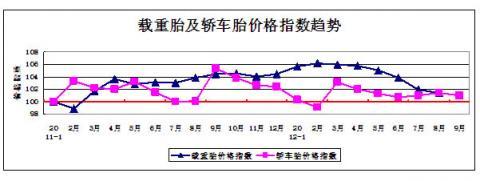
Figure 24: truck tires and passenger car tire price index trend
2. Car and motorcycle production and sales situation
Statistical analysis according to the China Association of Automobile Manufacturers, in September, the automobile production 1,660,900, a growth of 10.62%, up 3.67%; 1,617,400 sales growth of 8.17%, down 1.75%. In January-September, car sales 14,131,200 and 14,092,300, representing an increase of 4.98% and 3.37% respectively.
September, motorcycle sales 2,077,800 and 2,047,900, a growth of 6.16% and 2.88%, year-on-year decrease of 12.32% and 14.02%. In January-September, complete motorcycle production and sales of 17,577,800 and 17,684,900, down 11.55% and 11.21%.
3. Natural rubber and compound rubber imports condition
According to Chinese Customs statistics, in September 2012, the technical classification of natural rubber imports 160,500 tons, a decrease of 9.1% compared with the same period last year, imports amounted to $ 455 million, a decrease of 44.8% compared with the same period last year; September imports not primary forms of vulcanized compound rubber 4.7 million tons, a decrease of 20.3% compared with the same period last year, imports amounted to $ 137 million, a decrease of 50.3% compared with the same period last year. Technical classification of natural rubber price trend status since 2009 is shown in Figure 25.
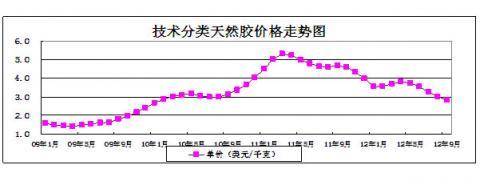
Figure 25: Technical classification of natural rubber price trend status
4. The bulk of the raw material price situation
September 2012 imports of # 3 the smoked rubber highest price of 30,000 yuan / ton, unchanged from last month ring; 5 # standard glue highest price of 23,170 yuan / ton, down 5.43% previous month; 20 # standard rubber highest price of 20,000 yuan / ton, last month the chain than a decrease of 13.79%; the butadiene rubber highest price of 21,100 yuan / ton, last month the chain fell 6.22%; the 1500 SBR highest price 19,200 yuan / ton, last month the chain fell 7.02% .
III. The main features of the economic operation of the third quarter 2012 and analysis
1. The current price of industrial output value and sales revenue year-on-year increase of the first three quarters of the industry continued to narrow.
According to the statistics of the Association of focus member companies, the industry at current prices of industrial output value of the first three quarters of year-on-year increase of 2.62%, an increase compared with the first quarter, narrowed to 6.74 percentage points, compared with the first half of the increase, narrowed to 2.44 percentage points; sales revenue year-on-year an increase of 1.97%, an increase compared with the first quarter, narrowed to 4.87 percentage points, compared with the first half of the increase, narrowed to 2.73 percentage points. Specific expertise in the tire industry at current prices of industrial output up 2.39%, sales revenue grew 1.01%, narrowed by 2.79 and 3.28 percentage points respectively over the first half of the increase; the cycle tire industry, the current price of industrial output value and sales revenue increased by 5.19% and 7.2 % increase compared with the first half increased by 0.55 percentage points and 0.85 percentage points; hose tape industry current price of industrial output value and sales revenue growth were 7.6% and 7.53%, narrowed 3.95 percentage points and 1.53 percentage points respectively over the first half of the increase.
2. Tire product yield higher than the increase in output value and sales revenue.
According to the statistics of the Association of focus member companies, the first three quarters, the integrated tire production increase of 2.95%, an increase from the previous month narrowed by 0.18 percentage point, to terminate the trend of monthly increase in tire production continues to expand this year. Meanwhile, due to the current price of industrial output value and sales revenue growth continued to narrow, the tire current prices of industrial output value and sales revenue increase was lower than the increase in production of tire products, the increase in output value and sales income below the yield increase of 0.56 and 1.94, respectively percentage points in the first half when the tire output growth is higher than the yield increase of 2.59 percentage points, and in the end of the previous year, tire output growth is higher than the yield increase of 16.55 percent. The analysts believe that this is upside down, on the one hand because of bulk raw materials such as natural rubber, synthetic rubber, lower prices, a reduction in costs, on the other hand, the industry should also focus on the export weakness, sluggish domestic market may lead throat price competition.
3. Industry export growth continued to narrow.
According to the statistics of the Association member companies key, the first three quarters, industry export delivery value achieved 3.54 percent growth year-on-year , an increase from the previous month narrowed by 1.51 percentage points, narrowed 4.33 percentage points compared with the first half of the increase. Tire export delivery value increased by 3.76%, compared with the first half of the increase, narrowed 3 .66 percent; tire export deliveries increased by 1.99%, narrowed by 1.3 percentage points compared with the first half of the increase .
4. The efficiency of the sector conditions continue to maintain good posture.
According to the statistics of the Association on the part of the professional members of the first three quarters, industry sales revenue margin was 5.01%, an increase of 0.1 percentage points compared with the previous month, compared with the same period last year, up 1.1 percentage points増; tire industry sales income margin reached 4.53%, an increase of 1.37 percentage points compared with the same period last year; the the cycle tire industry sales profit rate of 7.58%, an increase of 1.96 percentage points compared with the same period last year; hose the tape industry sales income margin of 6.78%, and compared to last year, an increase of 1.95 percentage points.


