Risk-off market tone eases on Russian troop pullback
Ongoing monetary policy uncertainty muddles equity outlook
Key Events
US futures for the Dow Jones, S&P 500, NASDAQ and Russell 2000 all rebounded on Tuesday and European stocks moved higher as tension surrounding the Russia/Ukraine threat eased.
Nevertheless, Treasury yields climbed, though gold dropped.
Global Financial Affairs
US contracts reversed out of negative territory earlier this morning, along with European equities after reports Russia’s defense ministry “was quoted as saying that some troops adjacent to Ukraine are returning to their bases.” This followed yesterday’s signal from the Kremlin that it remains open to further negotiations.
Still, the ongoing debate surrounding US monetary policy continues to remain in focus for investors, with some analysts warning that Fed policymakers could be overreacting to inflationary data. That assessment leaves markets without any real clarity on inflation and the path to tightening.
Earlier Tuesday, during the Asian session, most regional benchmarks closed lower. China’s Shanghai Composite however, remained in the green, rising 0.5% as the PBoC, the country’s central bank, increased liquidity and left one-year policy loan rates at 2.85%.
On Monday, during the Wall Street session, US equities were buffeted by another day of sharp volatility, roiled by the current, two primary themes: Ukraine and monetary policy.
After repeatedly rebounding intraday, the S&P 500 finished with a third consecutive decline. However, the broad benchmark did close off its lows. The small cap Russell 2000 continued to ‘underperform,’ down 0.58%. The NASDAQ 100 was the only major US average in the green, +0.10%.
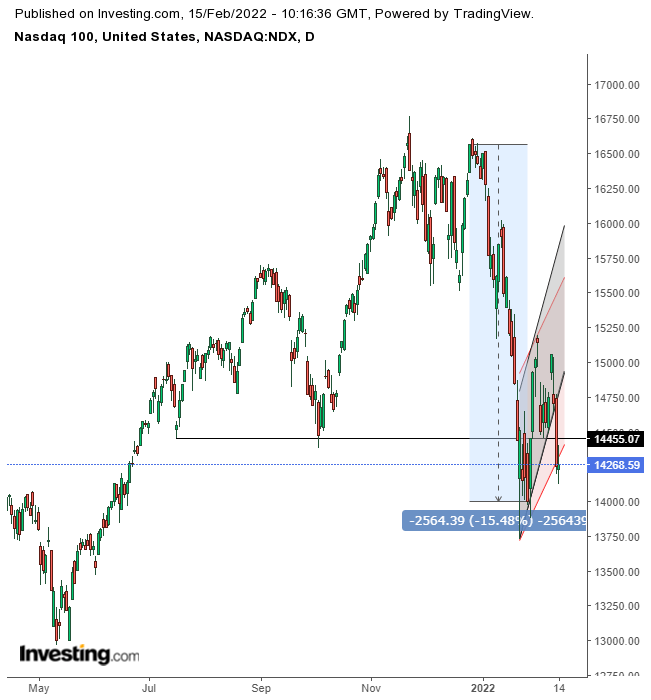 NDX Daily
The tech-heavy index formed a High Wave candle, denoting not only a loss of leadership, but an escalation of outright fear, as traders rushed to and fro, but ultimately finished the day near the opening price.
The price action took place right below an interpretation of a bearish flag (red), suggesting the price may rise toward the pattern’s top. According to that view, the flag is already complete (grey), and the candle would signal a return move to retest the flag.
Treasury yields, including for the 10-year benchmark note, climbed for a second day, reaching last Thursday’s levels, the highest point since July 30, 2019.
The move extends the rate surge since the Dec. 20 bottom, when Treasuries suffered the worst selloff in more than four decades. Observant readers will note that the period mentioned isn’t random. Rather, it corresponds to rising rates of inflation over the same period.
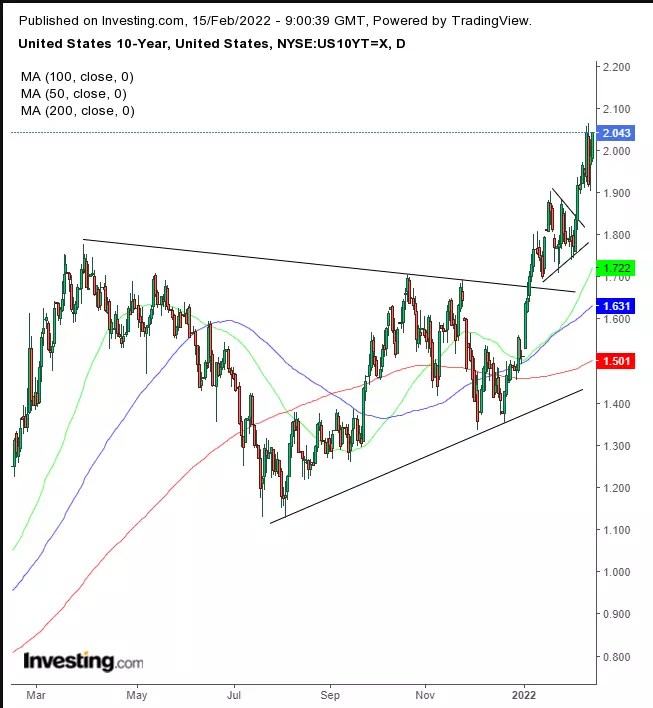 UST 10Y Daily
From a technical perspective, yields recently completed back-to-back continuation patterns. This development signals a continued rise in yields.
That provides a clear warning for stocks for two reasons: higher rates will make it more difficult for money managers to continue bidding up equities, and higher yields make Treasuries a more attractive investment venue than volatile stocks.
After a three-day rally, the dollar tumbled.
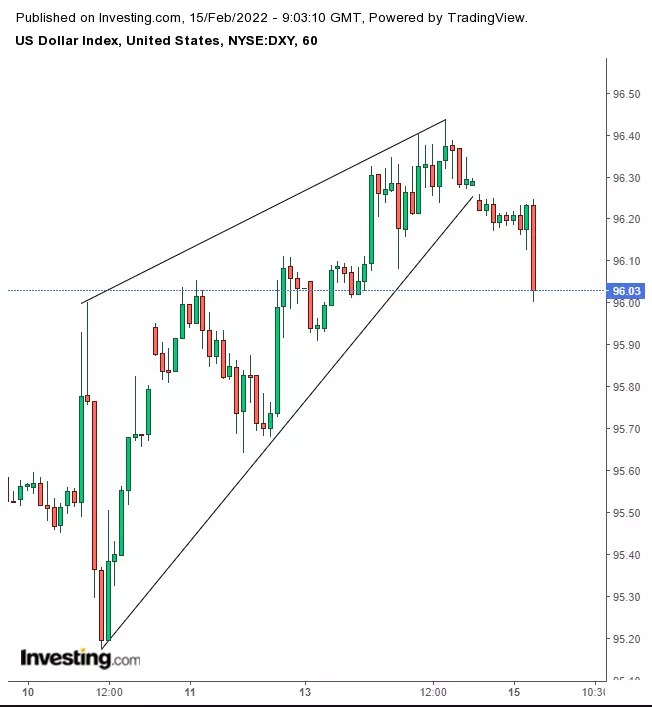 Dollar 60-Minute Chart
The greenback completed an hourly rising wedge, suggesting a return to the lower 95 levels.
Gold slumped, ending a seven-day upward streak.
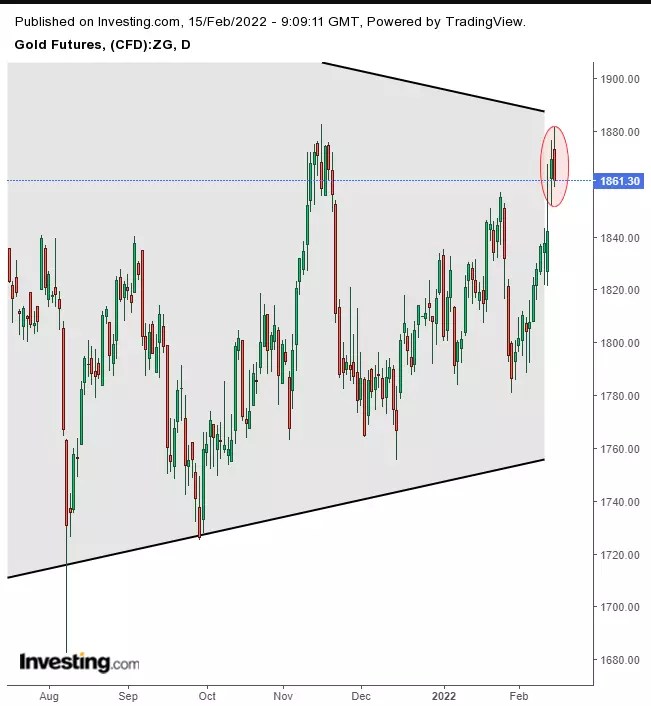 Gold Daily
The yellow metal opened higher this morning, but has since fallen below yesterday’s opening price, completing a Bearish Engulfing pattern. This price action occurs when both bulls and bears reveal their cards, with bears having the more substantial hand, pushing back yesterday’s bullish advance.
The two-day pattern developed at the top of a triangle, increasing the odds of a return to its bottom. But some technical analysts believe the precious metal’s move higher isn’t over quite yet.
Bitcoin joined risk assets in today’s rally.
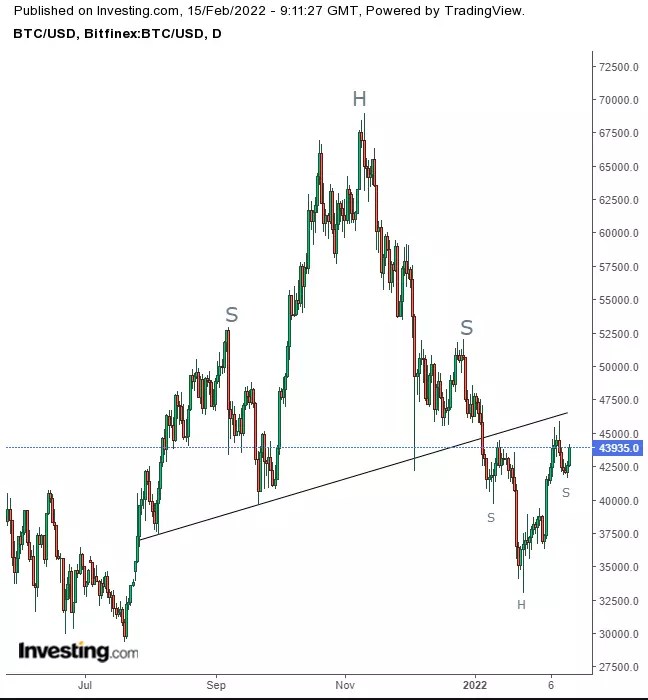 BTC/USD Daily
The digital token is forming a small H&S bottom, as bulls attempt to take on the much larger H&S since July.
Oil opened lower and extended the drop below $93, as traders took profit on the still-tense situation on the Ukraine border.
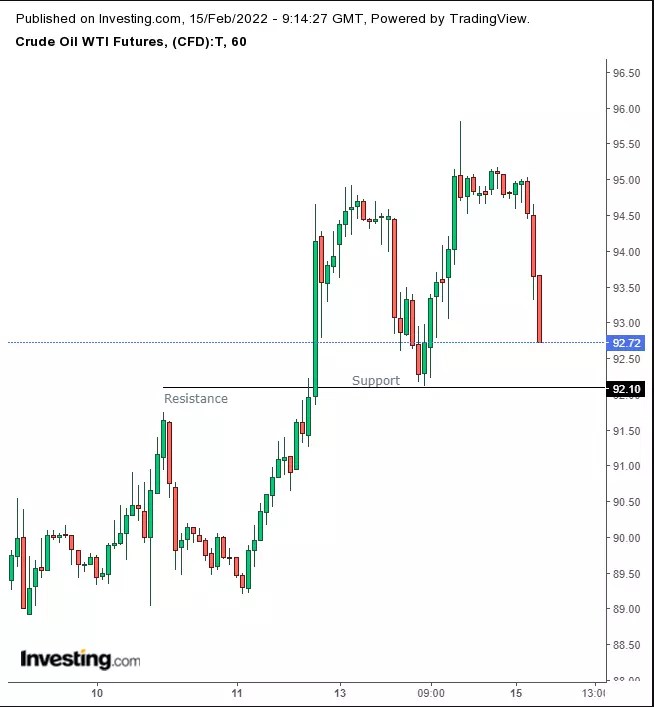 Oil 60-Minute Chart
If the price falls below $92, it will complete an hourly double-top, aiming at the $90 level.
Up Ahead
US PPI prints on Tuesday.
The EIA’s weekly crude oil inventories report is published on Wednesday.
Last month’s FOMC Minutes are released on Wednesday as well.
Cleveland Fed President Loretta Mester, St. Louis Fed President James Bullard both speak on Thursday.
Market Moves
Stocks
The Stoxx Europe 600 rose 0.6% as of 8:14 a.m. London time
Futures on the S&P 500 rose 0.4%
Futures on the NASDAQ 100 rose 0.7%
Futures on the Dow Jones Industrial Average rose 0.2%
The MSCI Asia Pacific Index fell 1.5%
The MSCI Emerging Markets Index fell 1.6%
Currencies
The Bloomberg Dollar Spot Index fell 0.2%
The euro rose 0.3% to $1.1336
The Japanese yen was little changed at 115.56 per dollar
The offshore yuan rose 0.1% to 6.3511 per dollar
The British pound rose 0.2% to $1.3554
Bonds
The yield on 10-year US Treasuries advanced two basis points to 2.01%
Germany’s 10-year yield was little changed at 0.28%
Britain’s 10-year yield was little changed at 1.59%
Commodities
WTI crude plunged 2.6% to $92.28
Brent crude dropped 2.77% to $94.34 a barrel
Spot gold was little changed
Source: Investing.com


![[Geojit Comtrade] Daily report on Natural Rubber: December 4, 2012](https://img.globalrubbermarkets.com/2024/08/geojit-comtrade-daily-report-on-natural-rubber-december-4-2012.jpg?resize=120%2C86&ssl=1)


