This article was written exclusively for Investing.com
Wild Withdrawal Season In Late 2021, Early 2022
The US Natural Gas Market Has Changed
Going Into Injection Season With Low Stockpiles
Europe Critical For US Natural Gas Market
Expect Lots Of Volatility- UNG is the natural gas ETF product
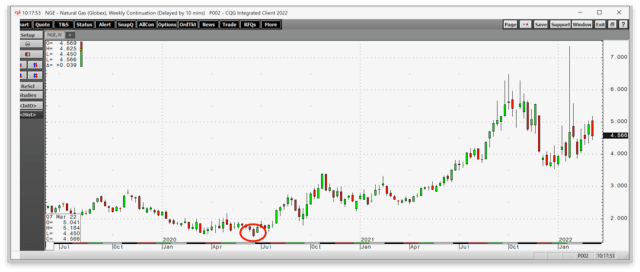
Natural gas began trading in the futures market in 1990. Over the past 32 years, the price has traded as low as $1.02 and as high as $15.65 per MMBtu. The last time the energy commodity was over the $10 level was in 2008, when a bearish trend began and took the price lower, making lower highs and lower lows for a dozen years until it found a bottom at $1.432 per MMBtu in June 2020.
The natural gas market is very different in 2022 than when trading began in 1990, and the supply and demand equation underwent a dramatic series of changes over the past years. The NYMEX futures market is the most direct route for US natural gas price exposure. The United States Natural Gas Fund (NYSE:UNG) is a liquid ETF product that moves higher or lower with the energy commodity’s price.
The June 2020 low was the lowest price for the energy commodity in 25 years and marked a bottom for natural gas futures. Since then, the market broke out of its 12-year bear market, making higher lows and higher highs in 2021 and experiencing wild price volatility in 2022.
Wild Withdrawal Season In Late 2021, Early 2022
The natural gas futures market began trending higher after reaching a low of $1.432 per MMBtu in June 2020.
 Natural Gas Weekly Chart.
Source: CQG
The weekly chart shows that natural gas moved above $2 per MMBtu in August 2020, eclipsed the $3 level in October 2020, and moved north of $4 in July 2021. In September 2021, the price moved above $5, and in October 2021, it reached $6.466 per MMBtu, the highest price since February 2014.
In January 2022, nearby natural gas futures spiked higher to $7.346, the highest price since late 2008. At just over $4.55 per MMBtu on Mar. 9, natural gas was at the highest level in years at the end of the annual withdrawal season, when the energy commodity begins flowing into storage.
The high price level going into the off-season comes as the US natural gas market has evolved.
US Natural Gas Market Has Changed
Discoveries of massive natural gas reserves in the US Marcellus and Utica Shale regions put pressure on the energy commodity’s price. Falling production costs, as fracking became a less expensive method of extracting the gas from the Earth’s crust, only put more pressure on the price. NYMEX natural gas futures made lower highs and lower lows from 2008 through June 2020.
Necessity is the mother of invention, so technological advances in processing gas into a liquid form allowed for a growing export market. US natural gas’ addressable market increased far beyond the pipeline network as ocean tankers carry the gas to regions where prices are far higher than in the US.
Meanwhile, the change in US energy policy in early 2021 supports alternative and renewable fuels and inhibits gas and oil production. As US liquefied natural gas demand has grown, supplies did not keep pace. Cheniere Energy (NYSE:LNG), a leading US processor and supplier, had sold LNG to Asian countries for years into the future. Without new processing refineries and terminals, there is little or no spare LNG for export into the 2040s. European demand exploded. And as Russia threatened to invade Ukraine, European natural gas prices soared as Europe depends on Russian supplies. The Feb. 24 invasion of Ukraine has only pushed natural gas prices higher. Sanctions on Russian oil and gas or retaliatory export bans may only increase European prices over the coming weeks and months.
The bottom line is that the US natural gas futures have transformed from a solely domestic to an international market. Prices across the US and world trade are at premiums or discounts to the Henry Hub price. However, the delivery point in Erath, Louisiana, is now far more sensitive to global supply and demand dynamics than in the past.
Going Into Injection Season With Low Stockpiles
Natural gas is moving towards the 2022 injection season, which will begin in the coming weeks.
 Weekly Natural Gas Storage Report
Source: EIA
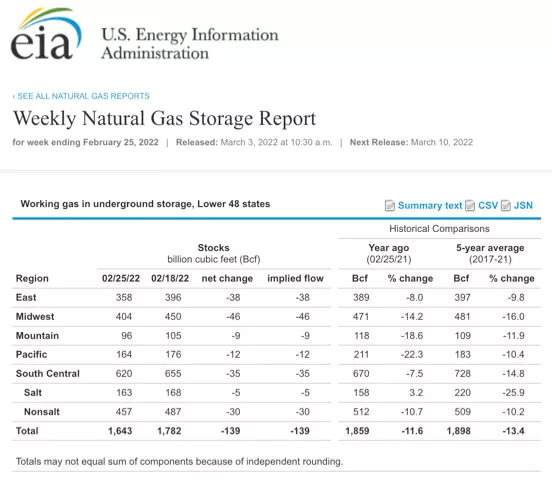
The chart shows that with almost one month before injections begin to push stockpiles higher, US inventories were 11.6% below last year’s level and 13.4% under the five-year average for the end of February. In 2020 and 2021, natural gas stocks fell to 1.986 and 1.750 trillion cubic feet, respectively. At the 1.643 tcf level on Feb. 25, stocks were already 107 bcf below the 2021 low, and they will fall over the coming weeks.
Stocks are low going into the injection season, and worldwide demand continues at a robust pace. If Europe begins to turn from Russia to the US for supplies, stocks could fall to deficient levels if the US administration does not allow output to increase.
Europe Critical For US Natural Gas Market
Vladimir Putin’s invasion of Ukraine started the first major conflict in Europe since World War II. The conditions are nothing short of a tragedy, with Russian troops leaving death and destruction in their path and millions of refugees moving to border countries and beyond. Russia has become an international pariah, with the US, Europe, and other allies slapping sanctions on Russian banks, exports, and individuals. Russia is retaliating with sanctions, export bans, and other measures.
Germany and Europe depend on Russian natural gas for heat and power. A decline or cut in supplies would push prices even higher and could create a crisis in the coming weeks and months. Europe will turn to the US for emergency supplies as there are quadrillions of cubic feet of natural gas sitting in the Marcellus and Utica shales. However, the Biden administration will need to dramatically pivot from its current green agenda to satisfy even some of Europe’s requirements.
Expect Lots Of Volatility
Natural gas broke out of a 12-year bear market in 2021 with a move to over $6.40 last year and above $7.30 per MMBtu in January 2022. Moreover, the price at the $4.90 level on the April NYMEX futures contract in March 2022 is the highest level in 14 years for this time of the year. I expect the changing dynamics in the natural gas market will cause the energy commodity to continue to make higher lows and higher highs over the coming years.
The most direct and liquid route for a risk position in the US natural gas market is via the futures and futures options that trade on the CME’s NYMEX division. For those looking to participate in the volatile natural gas market without venturing into the leveraged futures arena, the UNG ETF provides an alternative.
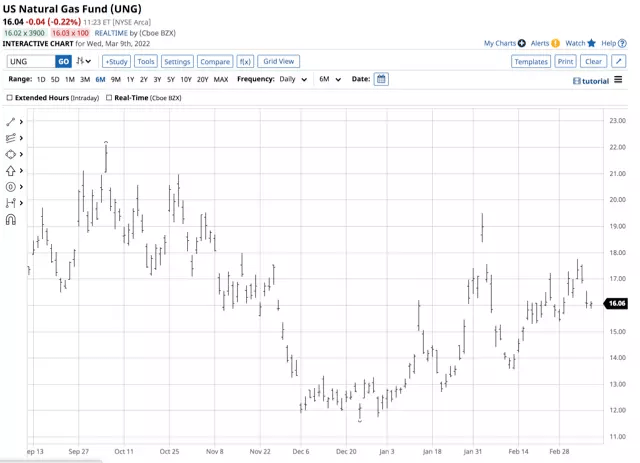
At the $16.04 level on Mar. 9, UNG had $320.147 million in assets under management. The ETF trades an average of over 8.8 million shares each day and charges a 1.35% management fee. April natural gas futures moved from $3.867 on Feb. 10 to a high of $5.184 per MMBtu on Mar. 7, a 34% increase.
 UNG Daily Chart.
Source: Barchart
Over the same period, the UNG ETF moved from $13.57 to $17.76 per share, or 30.9% higher. Natural gas futures trade around the clock during the week, while the UNG ETF only trades when the US stock market is operating, creating blackout periods when the futures make highs or lows when the stock market is closed.
Over the coming weeks, the natural gas market is moving into the injection season in the US, typically when prices move lower as demand declines. However, the spring of 2022 is anything but an ordinary time in markets across all asset classes, and natural gas is no exception. The US natural gas market has changed, and the price patterns will likely reflect the new dynamics.
Source: Investing.com


