Fed keeps becoming hawkish
Yields surge to 3-year highs
Investors will leave stocks to bonds and growth to value stocks
A battery of new as well as ongoing headwinds will likely drive significant volatility in the week ahead amidst a cyclical rotation in equities. Central bank policy decisions and inflation data will determine whether investors should continue to anticipate tighter monetary policy.
And big global banks will usher in the latest earnings season, potentially providing insight into why some international lenders might have to shift strategies to maintain growth.
Cyclical Rotation Second Wave In Progress
After the first COVID wave in 2020, economically sensitive sectors outperformed. During the pandemic, investors elevated Technology and Communication Services stocks, bidding up shares of companies whose products and platforms enabled shopping, socializing and working from home possible even during lockdowns—the new normal. At the same time, stocks of companies relevant to the old, normal life prior to the pandemic, were neglected and their share prices languished.
Then came a tipping point. It dawned on investors that they’d milked growth stocks for all they could get and suddenly humdrum companies whose businesses were just ‘standard’ fare such as food, clothing, utilities, and transportation were back in favor. These overlooked stocks were abruptly recognized as bargains, providing value.
Hence, the Wall Street herd rotated into such sectors as Energy, Financials, Industrials, and Materials. Now, investors are rotating out of Tech and Small Cap shares as tighter monetary policy becomes the current trigger—rising interest rates make it more difficult to justify lofty tech company valuations. Smaller domestic companies don’t have the resources and flexibility needed to thrive in a higher interest rate environment.
So what’s left? Large cap, non-tech companies.
Friday’s market activity illustrates the situation. Investors are rotating from growth shares to value and defensive stocks. The tech heavy NASDAQ 100 dropped 1.41%, underperforming among the major indices but the small cap Russell 2000, followed, slumping 0.76%. The only index that finished the final trading day of the week in the green was the Dow Jones, the 30-stock Blue Chip gauge which rose 0.4%. The broad S&P 500 Index was the second-best performer, with a 0.27% loss.
The same relationship is also visible on a weekly basis: the Russell plunged 4.62%, followed by a 3.59% drop for the NASDAQ 100. Once again, the Dow Jones excelled, retreating just 0.27%, followed by the 1.27% decline of the S&P 500.
The same pattern is visible via a sector drilldown on the SPX: technology stocks lost out to economically sensitive sectors across all time series up to one year.
On Friday, Technology dropped 1.4%, underperforming all the sectors. Energy outperformed, jumping 2.75%, followed by +1.01% for Financials.
On a weekly basis Technology lost 3.82% of value. Healthcare surged +3.45% as sector stocks hit record highs, with investors rushing for safety. Energy shares were the second-best performers climbing 3.21%.
From a monthly perspective, Healthcare jumped 11.98%, followed by a 10.92% gain for the Materials sector, almost double the performance of both Technology and Communication Services which were up about 6% each.
On a one-year basis, Communication Services was the only sector in the red, down 11.52% down while at the same time Energy led, up 63.95%.
Another, perhaps more obvious measure is that both the NASDAQ 100 and Russell 2000 are the only major US averages in bear markets, a dubious honor signifying an asset or index had declined at least 20% from its previous high.
The Russell 2000 fell 20.93% between its Nov. 8 record and Jan. 27 low. The NASDAQ 100 dropped 21.28% between its Nov. 19 high and Mar. 14 low.
Meanwhile, the S&P 500 fell only 13.95% from its Jan. 3 record and Mar. 8 low, while the Blue Chip Dow merely corrected 11.33% between its Jan. 4 record peak and Mar. 8 trough.
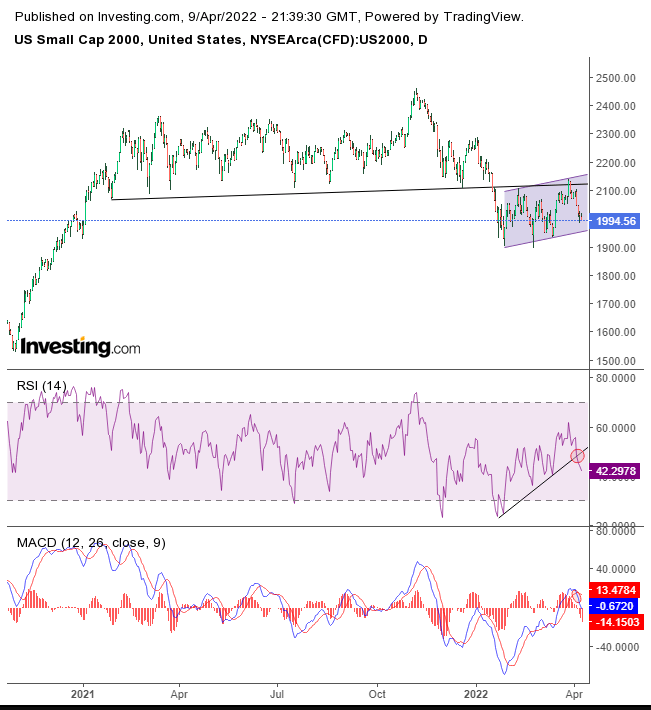
The Russell 2000 also appears to be in worse technical shape than its US major index peers.
 RUT Daily
The small cap index has topped out and rejected each attempt to climb back above the previous floor which has now become its ceiling. Plus, even after falling toward the bottom of its range (blue shaded area), indicators are showing there’s considerably more room to fall.
So, having acknowledged there’s already a new rotation in place, why should investors expect it to continue? Last week’s release of the FOMC Minutes revealed that many Fed officials were prepared to increase rates by 50 basis points in the coming months, signaling a continually more hawkish Fed could be ahead.
We should note that even if it acts more aggressively, the central bank could still end up chasing inflation rather than getting ahead of it, repeatedly hiking rates but still remaining one step behind rising inflation.
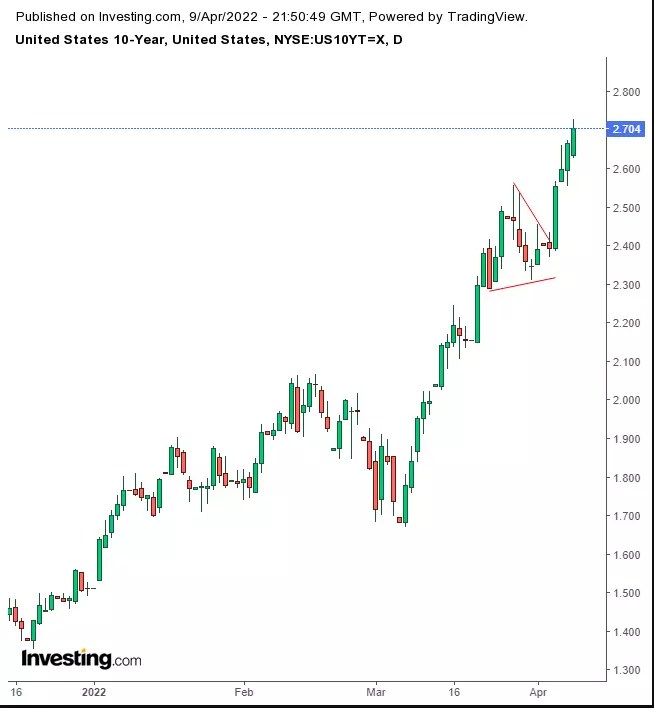
The benchmark 10-year Treasury closed Friday above 2.7% for the first time in three years. Investors are selling current Treasuries, anticipating later-dated debt whose yield will reflect higher interest rates.
 UST 10Y Daily
Yields on the benchmark note rose for four straight days, completing a bullish pennant. The pattern’s implied target tests the 3% critical level.
Not only will higher borrowing costs weigh heavily on stocks, but these yields will provide stiff competition for shares. Many investors were holding stocks only because zero interest rates decimated fixed-income securities. Now that yields are back in play, we expect a massive exodus out of equities, including by many institutional players.
Therefore, investors will be keeping an eye on central banks and inflation data in the upcoming week. The BoC and ECB have interest rate decisions upcoming while inflation data is due from China, the US, and the UK.
Earnings season also begins this coming week, with many big banks and financial firms reporting, including JPMorgan (NYSE:JPM), Goldman Sachs (NYSE:GS), BlackRock (NYSE:BLK), and Citigroup (NYSE:C). Analysts predict that net income for the six biggest American banks will drop by 35% YoY as lenders could reveal a steep decline in deal-making and trading given markets aren’t as flush compared to last year.
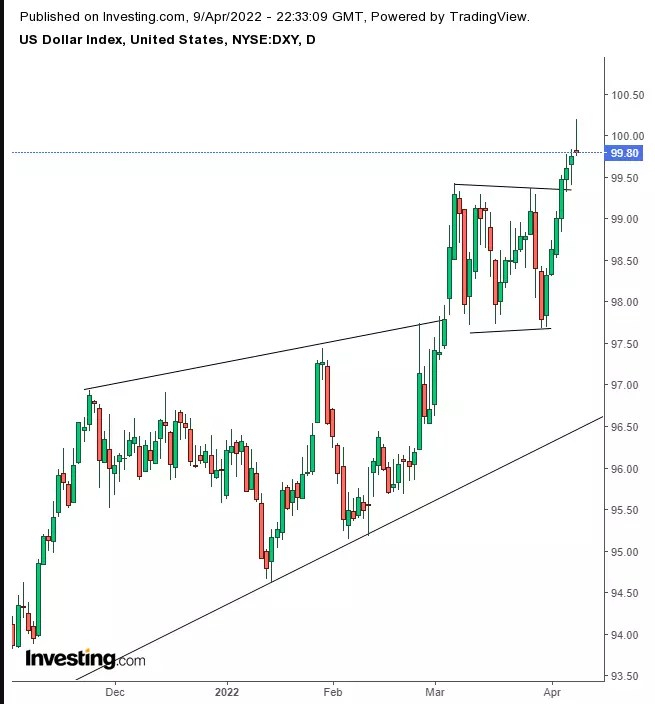
Still, the dollar rose for its seventh straight session, briefly topping the 100.00 level for the first time since May 2020.
 DXY Daily
The greenback extended a range penetration that confirmed the bullishness of the preceding H&S continuation pattern. However, Friday’s Shooting Star demonstrated a residual bearish presence. The price may fall back toward the range as buyers gobble up all remaining supply before the price heads toward 101. When the dollar scales the 104 level, it will have reached its highest position since 2002.
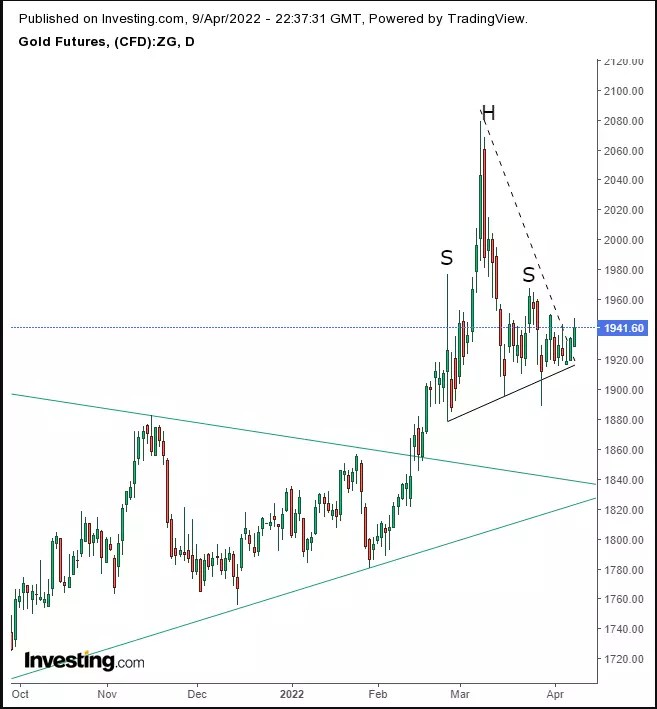
Gold climbed for the second day even against a strengthening dollar and despite the more hawkish Fed. Perhaps the ongoing Russia-Ukraine war and worries on future Fed positioning keep demand for the yellow metal high.
 Gold Daily
Since February, we have considered the precious metal’s trading pattern to be an H&S top. Perhaps though, it’s a Symmetrical Triangle that erupted topside on Friday. After gold achieved the implied target of a year-and-a-half-long Symmetrical Triangle, we thought the price might decrease. However, if Friday’s trading represents the trend, we can see gold making another go at the August 2020 record.
Bitcoin edged higher on Saturday, after Friday’s decline.
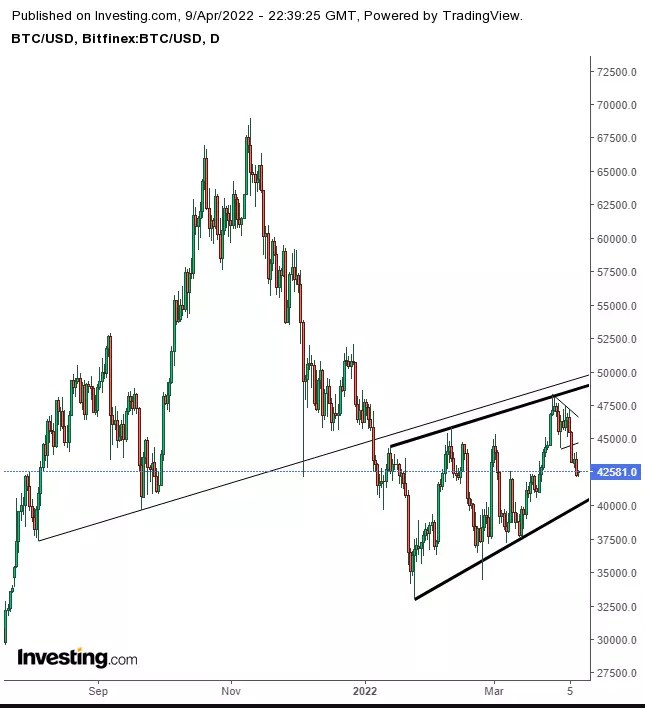 BTC/USD Daily
The digital token blew out a would-be bullish pennant after the neckline of a large H&S flexed its muscles. As of now, the cryptocurrency is trading within a rising channel, though still beneath the reversal pattern.
Oil rebounded on Friday from a three-day selloff but closed lower for a second week after US-allied IEA countries, together with the US said they’d tap into emergency reserves. Will Friday’s bounce last? Not according to the technical chart.
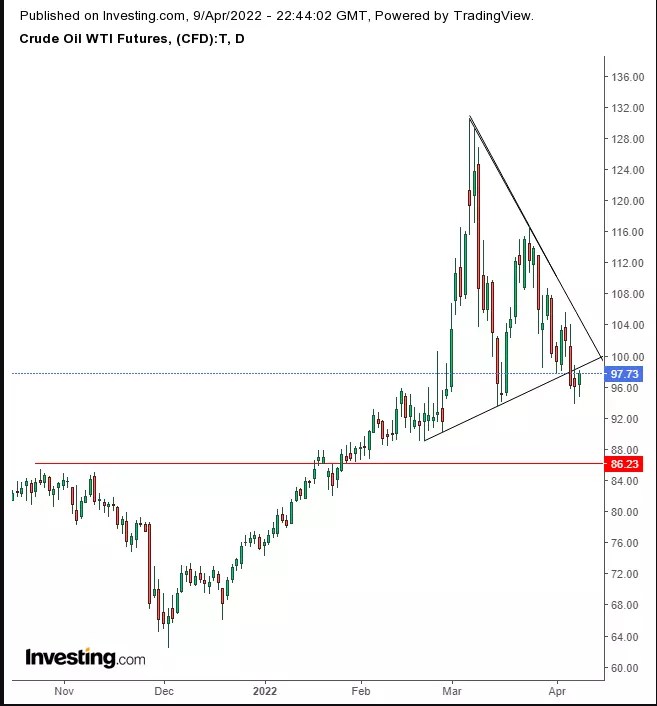 Oil Daily
WTI appeared to break to the downside of a Symmetrical Triangle. Barring any dramatic changes, the price could fall back into $80 levels on downside momentum.
The Week Ahead
All times listed are EDT
Sunday
21:30: China – CPI: seen to have risen to 1.2% in March.
Monday
2:00: UK – GDP: previously printed at 6.6% YoY.
2:00: UK – Manufacturing Production: expected to fall to 0.3% from 0.8%.
Tuesday
2:00: UK – Average Earnings Index +Bonus: seen to grow to 5.4% from 4.8%.
2:00: UK – Claimant Count Change: February’s reading was -48.1K.
5:00: Germany – ZEW Economic Sentiment: forecast to plunge further to -48.0 from -39.3.
8:30: US – Core CPI: probably remained flat at 0.5% MoM.
21:00: New Zealand – RBNZ Interest Rate Decision: predicted to rise to 1.25% from 1.00%.
22:00: New Zealand – RBNZ Rate Statement
Wednesday
2:00: UK – CPI: expected to rise to 6.7% from 6.2% YoY, while retreating to 0.7% from 0.8% MoM.
8:30: US – PPI: to advance to 1.1% in March, from 0.8% previously.
10:00: Canada – BoC Interest Rate Decision: predicted to double to 1.00% from 0.50%.
10:30: US – Crude Oil Inventories: last week’s release showed a build of 2.421M bbl.
21:30: Australia – Employment Change: forecast to nearly halve to 40.0K from 77.4K.
Thursday
7:45: Eurozone: Deposit Facility Rate: to remain flat at -0.50%.
7:45: Eurozone – ECB Interest Rate Decision
8:30: US – Initial Jobless Claims: expected to rise to 173K from 166K.
8:30: US – Retail Sales: anticipated to have doubled to 0.6% from 0.3% in March.
8:30: Eurozone – ECB Press Conference
Friday
Good Friday Holiday: US, UK, Eurozone, Australia, New Zealand and other global markets closed
Source: Investing.com


