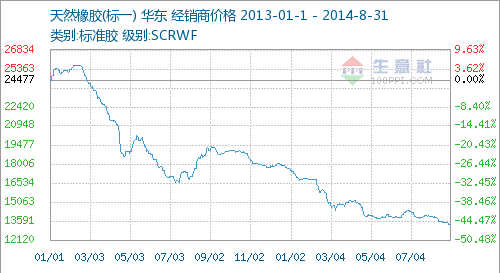
1. Natural rubber price chart

August natural rubber as a whole showed a downward trend shock, the average price of 13,953 yuan in early / ton, the average price of 13,346 yuan at the end / ton, down 4.35%.
2. Market analysis
According to the business community monitoring natural rubber prices, August natural rubber shock down the overall monthly decline 4.35%. Natural rubber (labeled a) Commodity Index August 31 to 39.58, the historical record cycle low, compared with September 1, 2011 the highest point of 100.00 points dropped 60.42%. (Note: The period refers 2011-09-01 far)
Rubber market overall weak demand, thinly traded. Prices continued downward, record lows. Supply and demand is still the main factor restricting rubber prices. Supply, at a time when the tapping season, and the current 13-year-old rubber inventory is still high, despite declining domestic Qingdao Free Trade Zone, as of mid-August, Qingdao Bonded Rubber total inventory dropped sharply to 234,100 tons, the contradiction between supply and demand is still outstanding, the market pressure. Meanwhile, the downstream demand is low, thinly traded. The United States on Chinese tires double reverse, Thailand throwing a series of unfavorable factors storage constraints Jiaojia.
3. Investors predict
Social business analysts believe natural rubber, natural rubber vulnerable for a long time, the overall market oversupply situation is difficult to improve in the short term, by the many negative effects of natural rubber prices should remain low volatility.
Translated by Google Translator from http://market.cria.org.cn/25/23062.html


