US500
-0.23%
Add to/Remove from Watchlist
Add to Watchlist
Add Position
Position added successfully to:
Please name your holdings portfolio
Type:
BUY
SELL
Date:
Amount:
Price
Point Value:
Leverage:
1:1
1:10
1:25
1:50
1:100
1:200
1:400
1:500
1:1000
Commission:
Create New Watchlist
Create
Create a new holdings portfolio
Add
Create
+ Add another position
Close
Initial signs from earnings suggest that EPS growth bottomed last quarter
Going ahead, it looks like the rebound could continue into next year
Meanwhile, majority of the stocks in S&P 500 remain undervalued
Quarterly earnings reports have begun to pour in on a positive note, especially for the big banks. In fact, based on the performance of the companies that have already reported so far, the current trend indicates that we have already bottomed out in the previous quarter.
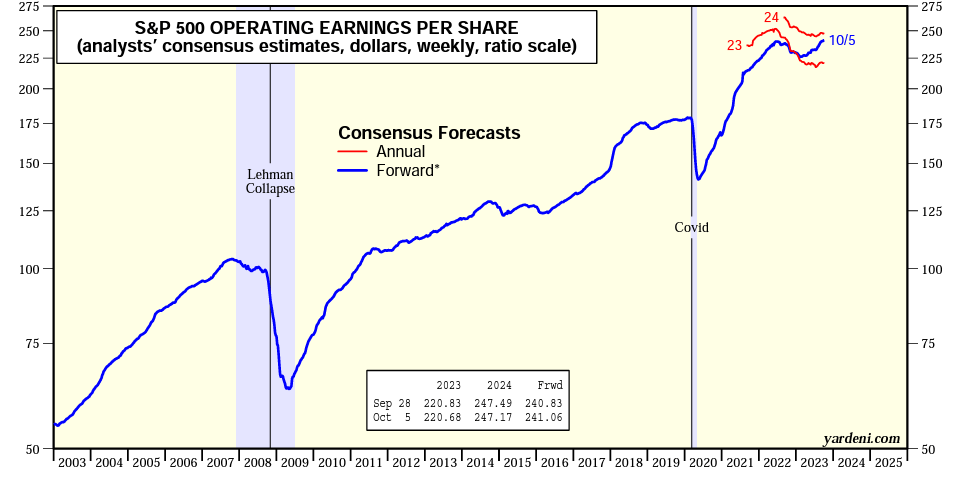
Accordingly, Ed Yardeni’s projections suggest that earnings per share (EPS) for 2023 are likely to reach approximately $221 per share, with an expected increase to $247 per share in 2024.
 S&P 500 EPS Forecasts
Source: Ed Yardeni
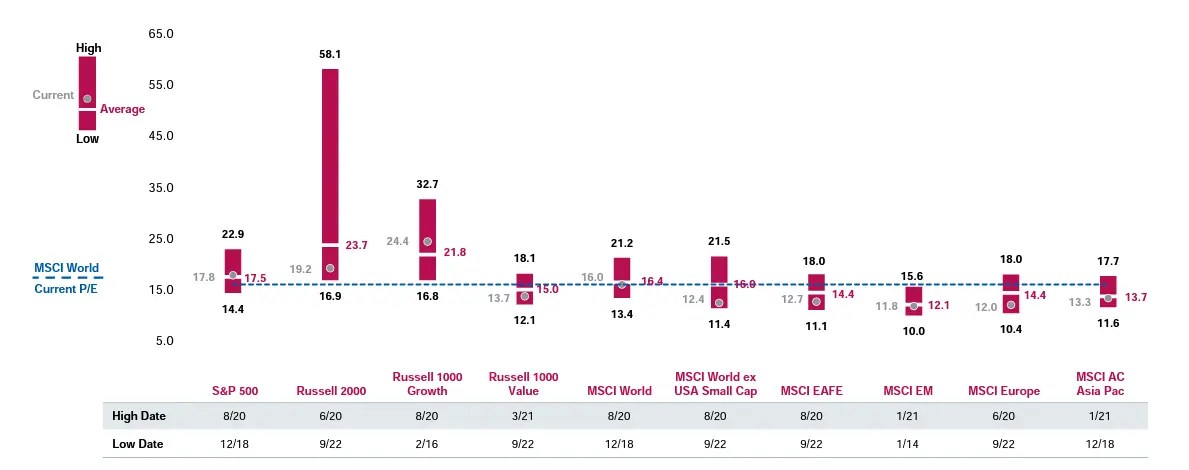
A P/E ratio of approximately 17.5 for the S&P 500 index implies that the fair value for the index should be at around 3,900 points.
However, looking ahead to 2024’s expected EPS growth, we can anticipate the fair value for the index to be in the vicinity of 4,331 points, which is approximately in line with the current price.
 Current P/E for Indexes
Source: Eaton Vance
The aforementioned figure needs to be viewed with two significant considerations:
The influence of the Big 7 on pushing the index to higher levels.
The inherent nature of markets, which tend to be either above or below the average.
Most S&P 500 Stocks Undervalued Despite Index’s Gains This Year
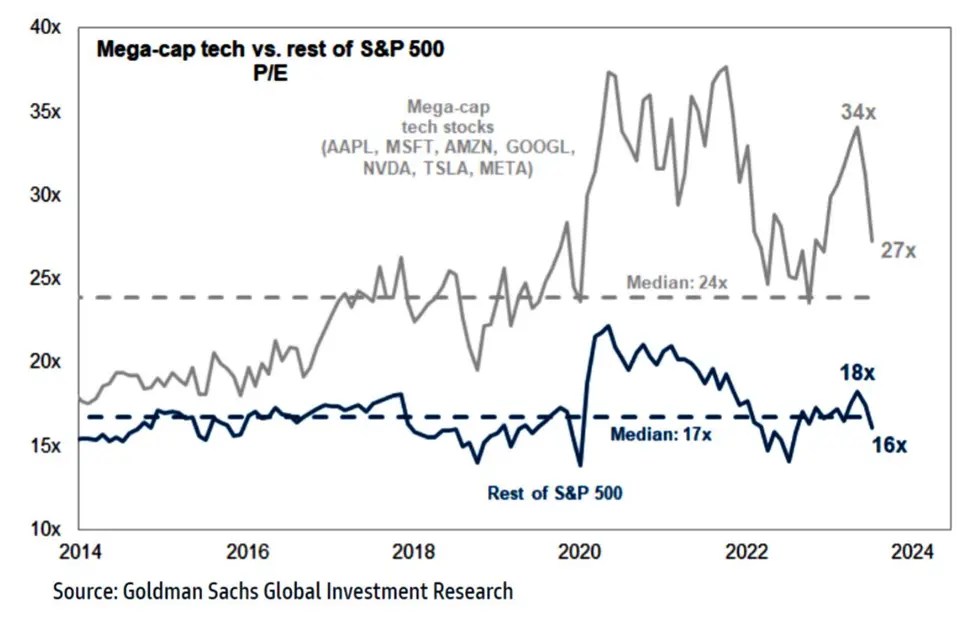
Regarding the Big 7, these large-cap U.S. tech stocks trade at considerably higher valuations compared to the other 493 stocks in the index.
 Mega Caps Vs. Rest of S&P 500
Source: Goldman Sachs
This dynamic certainly skews the overall index valuations towards the higher end, but it’s important to note that most stocks still trade at lower valuations.
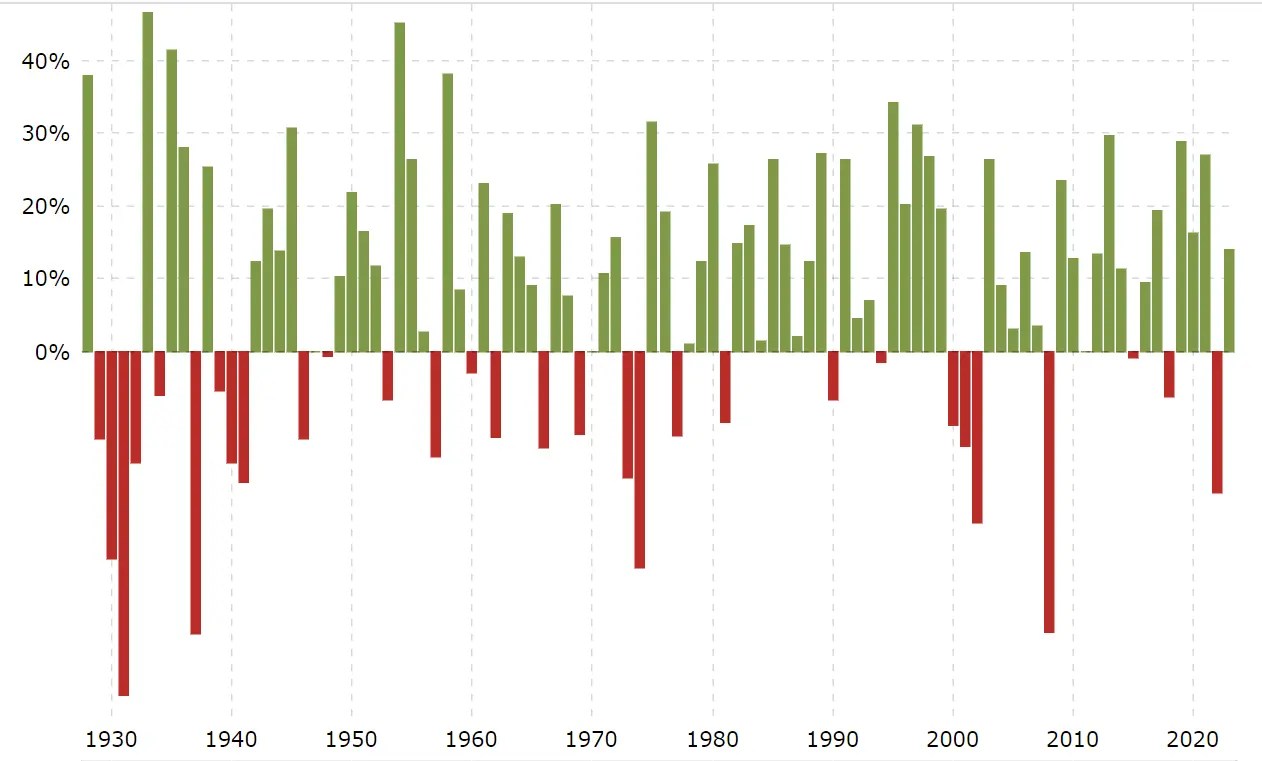
As for the second point, here’s a practical example: It’s common knowledge that, on average and over the long term, the U.S. stock market delivers an annual return of approximately 9 to 10%.
 Stock Market Yields History
Source: Macrotrends
However, upon closer examination of yearly performance, you’ll notice that the index rarely delivers a consistent 9 or 10% return each year. Instead, returns often vary significantly. This same principle can be applied to P/E ratios.
What drives these wide short-term variations?
The answer is simple: investor psychology and sentiment.
This is why, as investors, it’s important to focus on valuations, particularly when they deviate from fair value (a concept known as the “margin of safety”). This approach ensures that our investments are poised for long-term success.
***
 Tesla Earnings: What to Expect?
Disclaimer: This article is written for informational purposes only; it does not constitute a solicitation, offer, advice, counseling or recommendation to invest as such it is not intended to incentivize the purchase of assets in any way. I would like to remind you that any type of assets, is evaluated from multiple points of view and is highly risky and therefore, any investment decision and the associated risk remains with the investor.
Source: Investing.com


