US500
+0.13%
Add to/Remove from Watchlist
Add to Watchlist
Add Position
Position added successfully to:
Please name your holdings portfolio
Type:
BUY
SELL
Date:
Amount:
Price
Point Value:
Leverage:
1:1
1:10
1:25
1:50
1:100
1:200
1:400
1:500
1:1000
Commission:
Create New Watchlist
Create
Create a new holdings portfolio
Add
Create
+ Add another position
Close
MSFT
-1.68%
Add to/Remove from Watchlist
Add to Watchlist
Add Position
Position added successfully to:
Please name your holdings portfolio
Type:
BUY
SELL
Date:
Amount:
Price
Point Value:
Leverage:
1:1
1:10
1:25
1:50
1:100
1:200
1:400
1:500
1:1000
Commission:
Create New Watchlist
Create
Create a new holdings portfolio
Add
Create
+ Add another position
Close
GOOGL
-1.18%
Add to/Remove from Watchlist
Add to Watchlist
Add Position
Position added successfully to:
Please name your holdings portfolio
Type:
BUY
SELL
Date:
Amount:
Price
Point Value:
Leverage:
1:1
1:10
1:25
1:50
1:100
1:200
1:400
1:500
1:1000
Commission:
Create New Watchlist
Create
Create a new holdings portfolio
Add
Create
+ Add another position
Close
AAPL
-0.01%
Add to/Remove from Watchlist
Add to Watchlist
Add Position
Position added successfully to:
Please name your holdings portfolio
Type:
BUY
SELL
Date:
Amount:
Price
Point Value:
Leverage:
1:1
1:10
1:25
1:50
1:100
1:200
1:400
1:500
1:1000
Commission:
Create New Watchlist
Create
Create a new holdings portfolio
Add
Create
+ Add another position
Close
AMZN
+1.65%
Add to/Remove from Watchlist
Add to Watchlist
Add Position
Position added successfully to:
Please name your holdings portfolio
Type:
BUY
SELL
Date:
Amount:
Price
Point Value:
Leverage:
1:1
1:10
1:25
1:50
1:100
1:200
1:400
1:500
1:1000
Commission:
Create New Watchlist
Create
Create a new holdings portfolio
Add
Create
+ Add another position
Close
NVDA
-0.37%
Add to/Remove from Watchlist
Add to Watchlist
Add Position
Position added successfully to:
Please name your holdings portfolio
Type:
BUY
SELL
Date:
Amount:
Price
Point Value:
Leverage:
1:1
1:10
1:25
1:50
1:100
1:200
1:400
1:500
1:1000
Commission:
Create New Watchlist
Create
Create a new holdings portfolio
Add
Create
+ Add another position
Close
TSLA
+0.30%
Add to/Remove from Watchlist
Add to Watchlist
Add Position
Position added successfully to:
Please name your holdings portfolio
Type:
BUY
SELL
Date:
Amount:
Price
Point Value:
Leverage:
1:1
1:10
1:25
1:50
1:100
1:200
1:400
1:500
1:1000
Commission:
Create New Watchlist
Create
Create a new holdings portfolio
Add
Create
+ Add another position
Close
META
+0.25%
Add to/Remove from Watchlist
Add to Watchlist
Add Position
Position added successfully to:
Please name your holdings portfolio
Type:
BUY
SELL
Date:
Amount:
Price
Point Value:
Leverage:
1:1
1:10
1:25
1:50
1:100
1:200
1:400
1:500
1:1000
Commission:
Create New Watchlist
Create
Create a new holdings portfolio
Add
Create
+ Add another position
Close
GOOG
-1.27%
Add to/Remove from Watchlist
Add to Watchlist
Add Position
Position added successfully to:
Please name your holdings portfolio
Type:
BUY
SELL
Date:
Amount:
Price
Point Value:
Leverage:
1:1
1:10
1:25
1:50
1:100
1:200
1:400
1:500
1:1000
Commission:
Create New Watchlist
Create
Create a new holdings portfolio
Add
Create
+ Add another position
Close
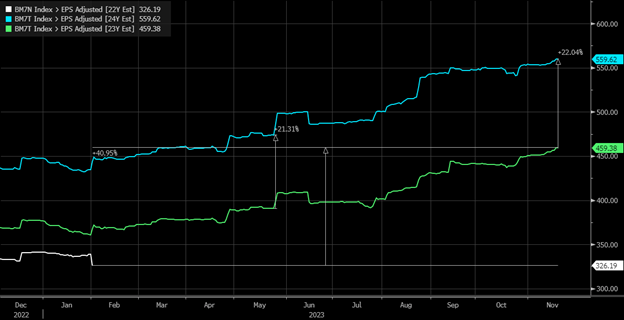
Nvidia (NASDAQ:NVDA) earnings carry a lot of weight for the entire market because expectations for earnings growth from the chipmaker drive much of the success of the Magnificent Seven and, thus, the S&P 500. If you want to know why the Magnificent Seven has outperformed this year, it is primarily because of expected earnings growth of some 40% this year and then by 22% next year.
This is the only part of the S&P 500 growing at this pace, especially considering the S&P 500 is expected to see no growth in 2023 and about 10% growth in 2024, based on the Bloomberg Magnificent 7 index. The S&P 500 equal weight index is up less than 5%.
 Mag7 Index-EPS
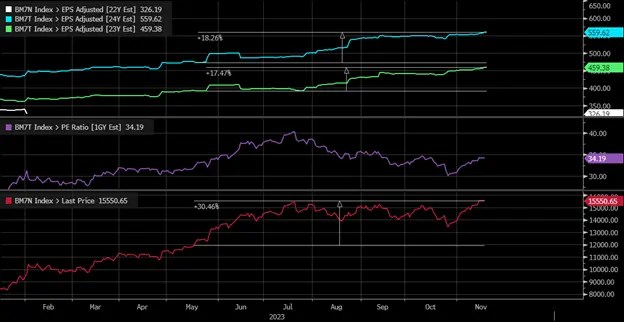
Since the middle of May, when Nvidia reported the blowout earnings report and gave significantly higher than expected guidance, earnings estimates for the group have increased by 17.5% for this year and 18.3% for next year. This, plus some multiple expansions, has helped to drive the Magingificant 7 index higher by around 30%.
 Mag7-Growth
Since mid-May, earnings revisions for most of the companies have been modest, and perhaps surprisingly, Apple (NASDAQ:AAPL), Microsoft (NASDAQ:MSFT), and Alphabet (NASDAQ:GOOGL) have seen hardly any upward revisions to their forecast, while Tesla (NASDAQ:TSLA) has seen its earnings forecast slashed.
Meta (NASDAQ:META) has seen healthy upward revisions, and anyone who has followed Amazon (NASDAQ:AMZN) long enough knows that earnings growth from the company is not dependable. The only company that has seen a huge and outsized increase in earnings revisions is Nvidia. Nvidia’s earnings estimates since its May earnings reports have risen by almost 140% for fiscal year 2024 and 190% for fiscal year 2025.
 NVIDIA Growth
Source: Bloomberg
Therefore, it seems pretty logical to assume that almost all of the increase in earnings estimates we have seen in the Magnificent Seven has come from Nvidia since the rest of the index is not delivering much if any, increase in earnings revisions since the middle of May. Additionally, Nvidia accounts for about 25% of the overall growth in the total index from this year to next year.
This tells us just how important Nvidia has become to the story of the Magnificent Seven and, more importantly, how vital guidance from the company will be when it reports results this week. It will need to support the current earnings estimates and, more importantly, be better than expected to drive earnings growth higher to help propel the market further to the upside.
 NVIDIA-Contribution
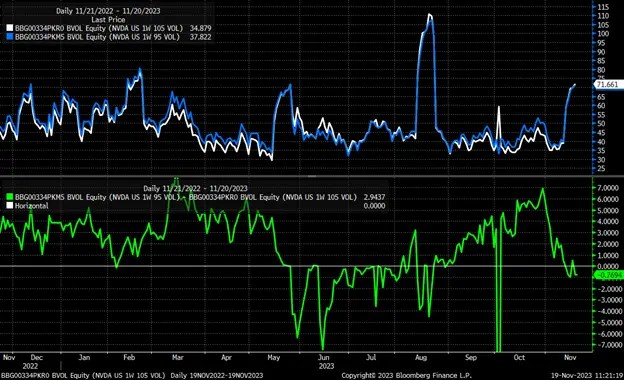
The options market appears to be very bullish on Nvidia, at least based on the skew of the 95% and 105% moneyness strike prices. The skew has swung back to the call side of the equation from heavily skewed to the puts side. This tells us that implied volatility for the calls is rising, which suggests that the demand for the calls is stronger than that of the puts. This is similar to what was seen in the July.
 NVDA-Weekly Volume Chart
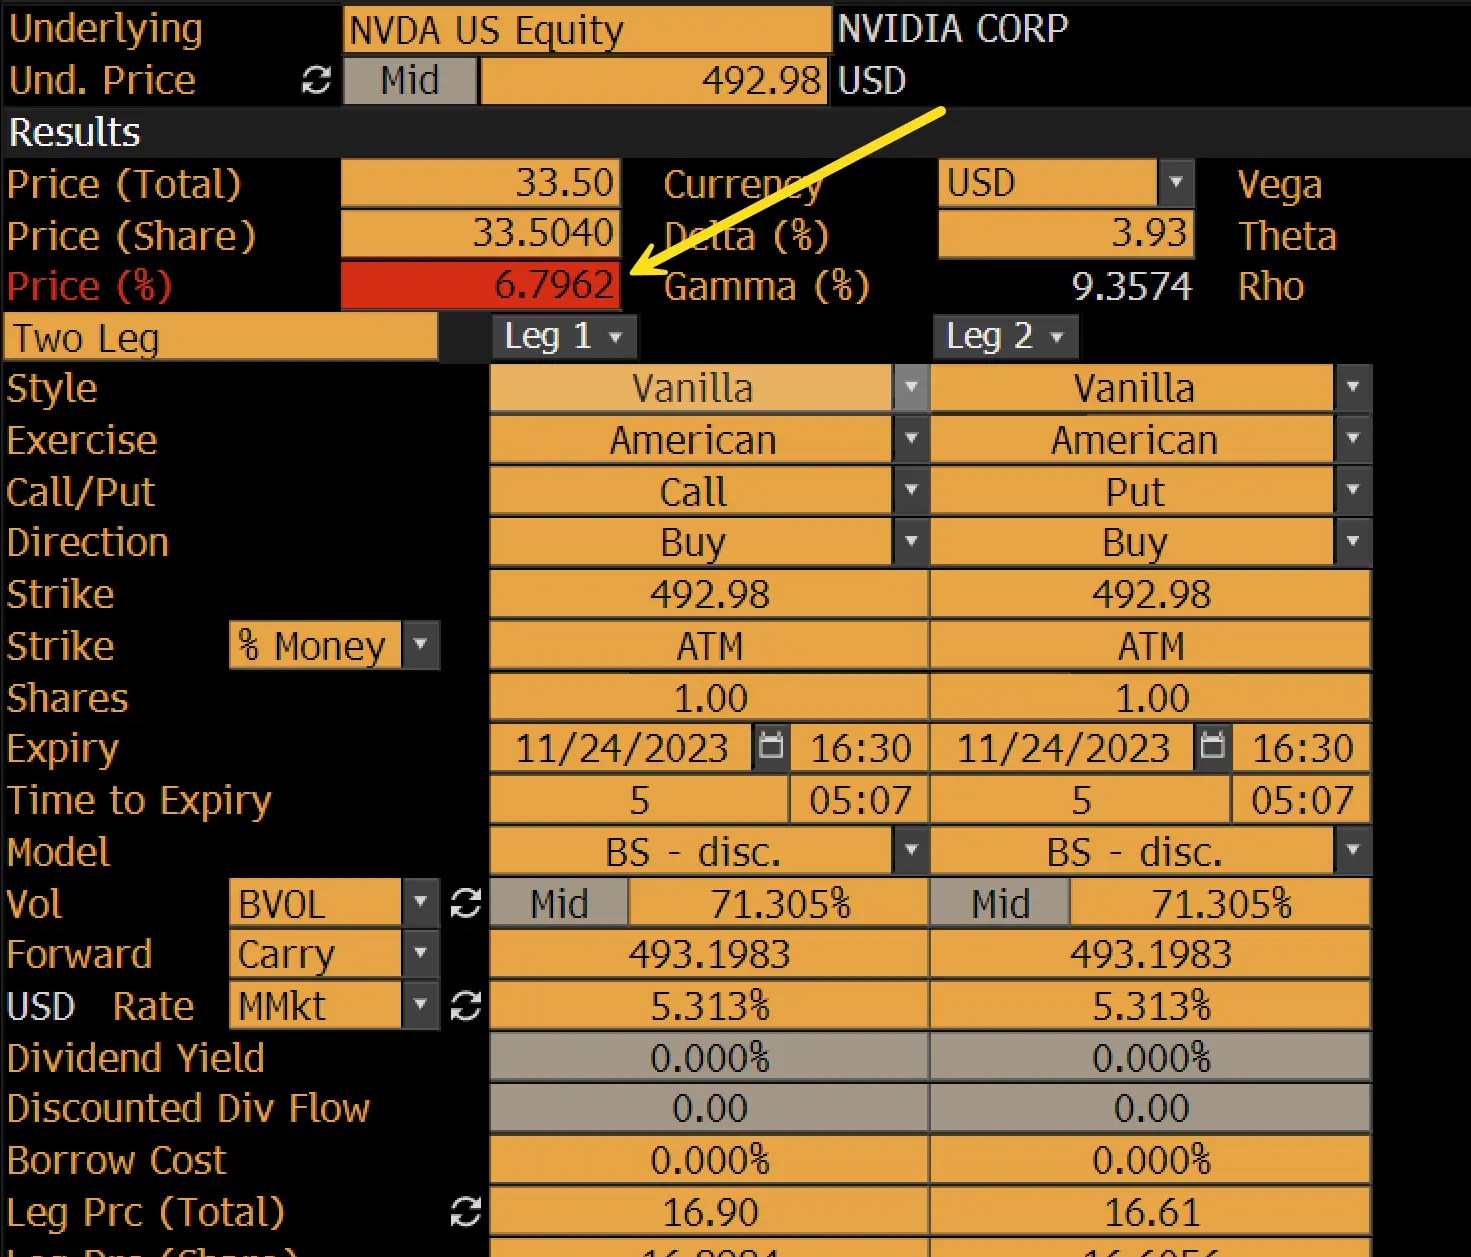
The Nvidia long straddle, which means owning one call and one put for the same expiration date, suggests the stock rises or falls by 6.8% by options expiring on November 24. One would think that as we approach results on November 21 after the close of trading, that IV continues to rise, and that implied move also increases.
 NVDA-Long Straddle
Source: Bloomberg
This means that once the results come out, the implied volatility, which I assume will be at levels equal to that of July at over 100%, will melt, and that means that the values of the puts and the calls will start to decay as the IV returns to lower levels. It is important to remember that the market is closed on Thursday and is only a half day on Friday. Additionally, since the call activity has been heavier, there is far more call delta for expiration on Friday than the put delta.
Based on the data from Bloomberg and what I could calculate, the max call delta comes at $500. I estimate a total notional call delta of about $3.33 billion, a notional put delta of about $1.06 billion, and a total positive delta of $2.28 billion. This tells us that instead of an implied volatility crush sending the stock higher as puts and calls lose value, causing market makers to buy back hedges, since skew typically put heavy, when the calls start to lose value, the stock will see market maker most likely unwind long hedging and sell the stock.
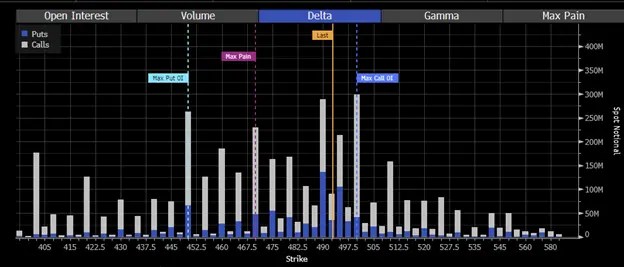 NVDA-Call Delta
Source: Bloomberg
Suppose the results are stellar and significantly better than the expected $3.36 per share and $16.1 billion in revenue for the fiscal third quarter, and the guidance for the fourth quarter is considerably better than the $3.76 per share and $17.9 billion revenue estimates, then the stock could rise. However, it would seem that anything inline or slightly better, may not be good enough and could result in the stock falling.
The stock has certainly been range-bound for a few months now, and if one wanted to, you call this a solid five waves up for the stock if you go back to the rally that started in 2015. Some Fibonacci levels seem to work in more than one place.
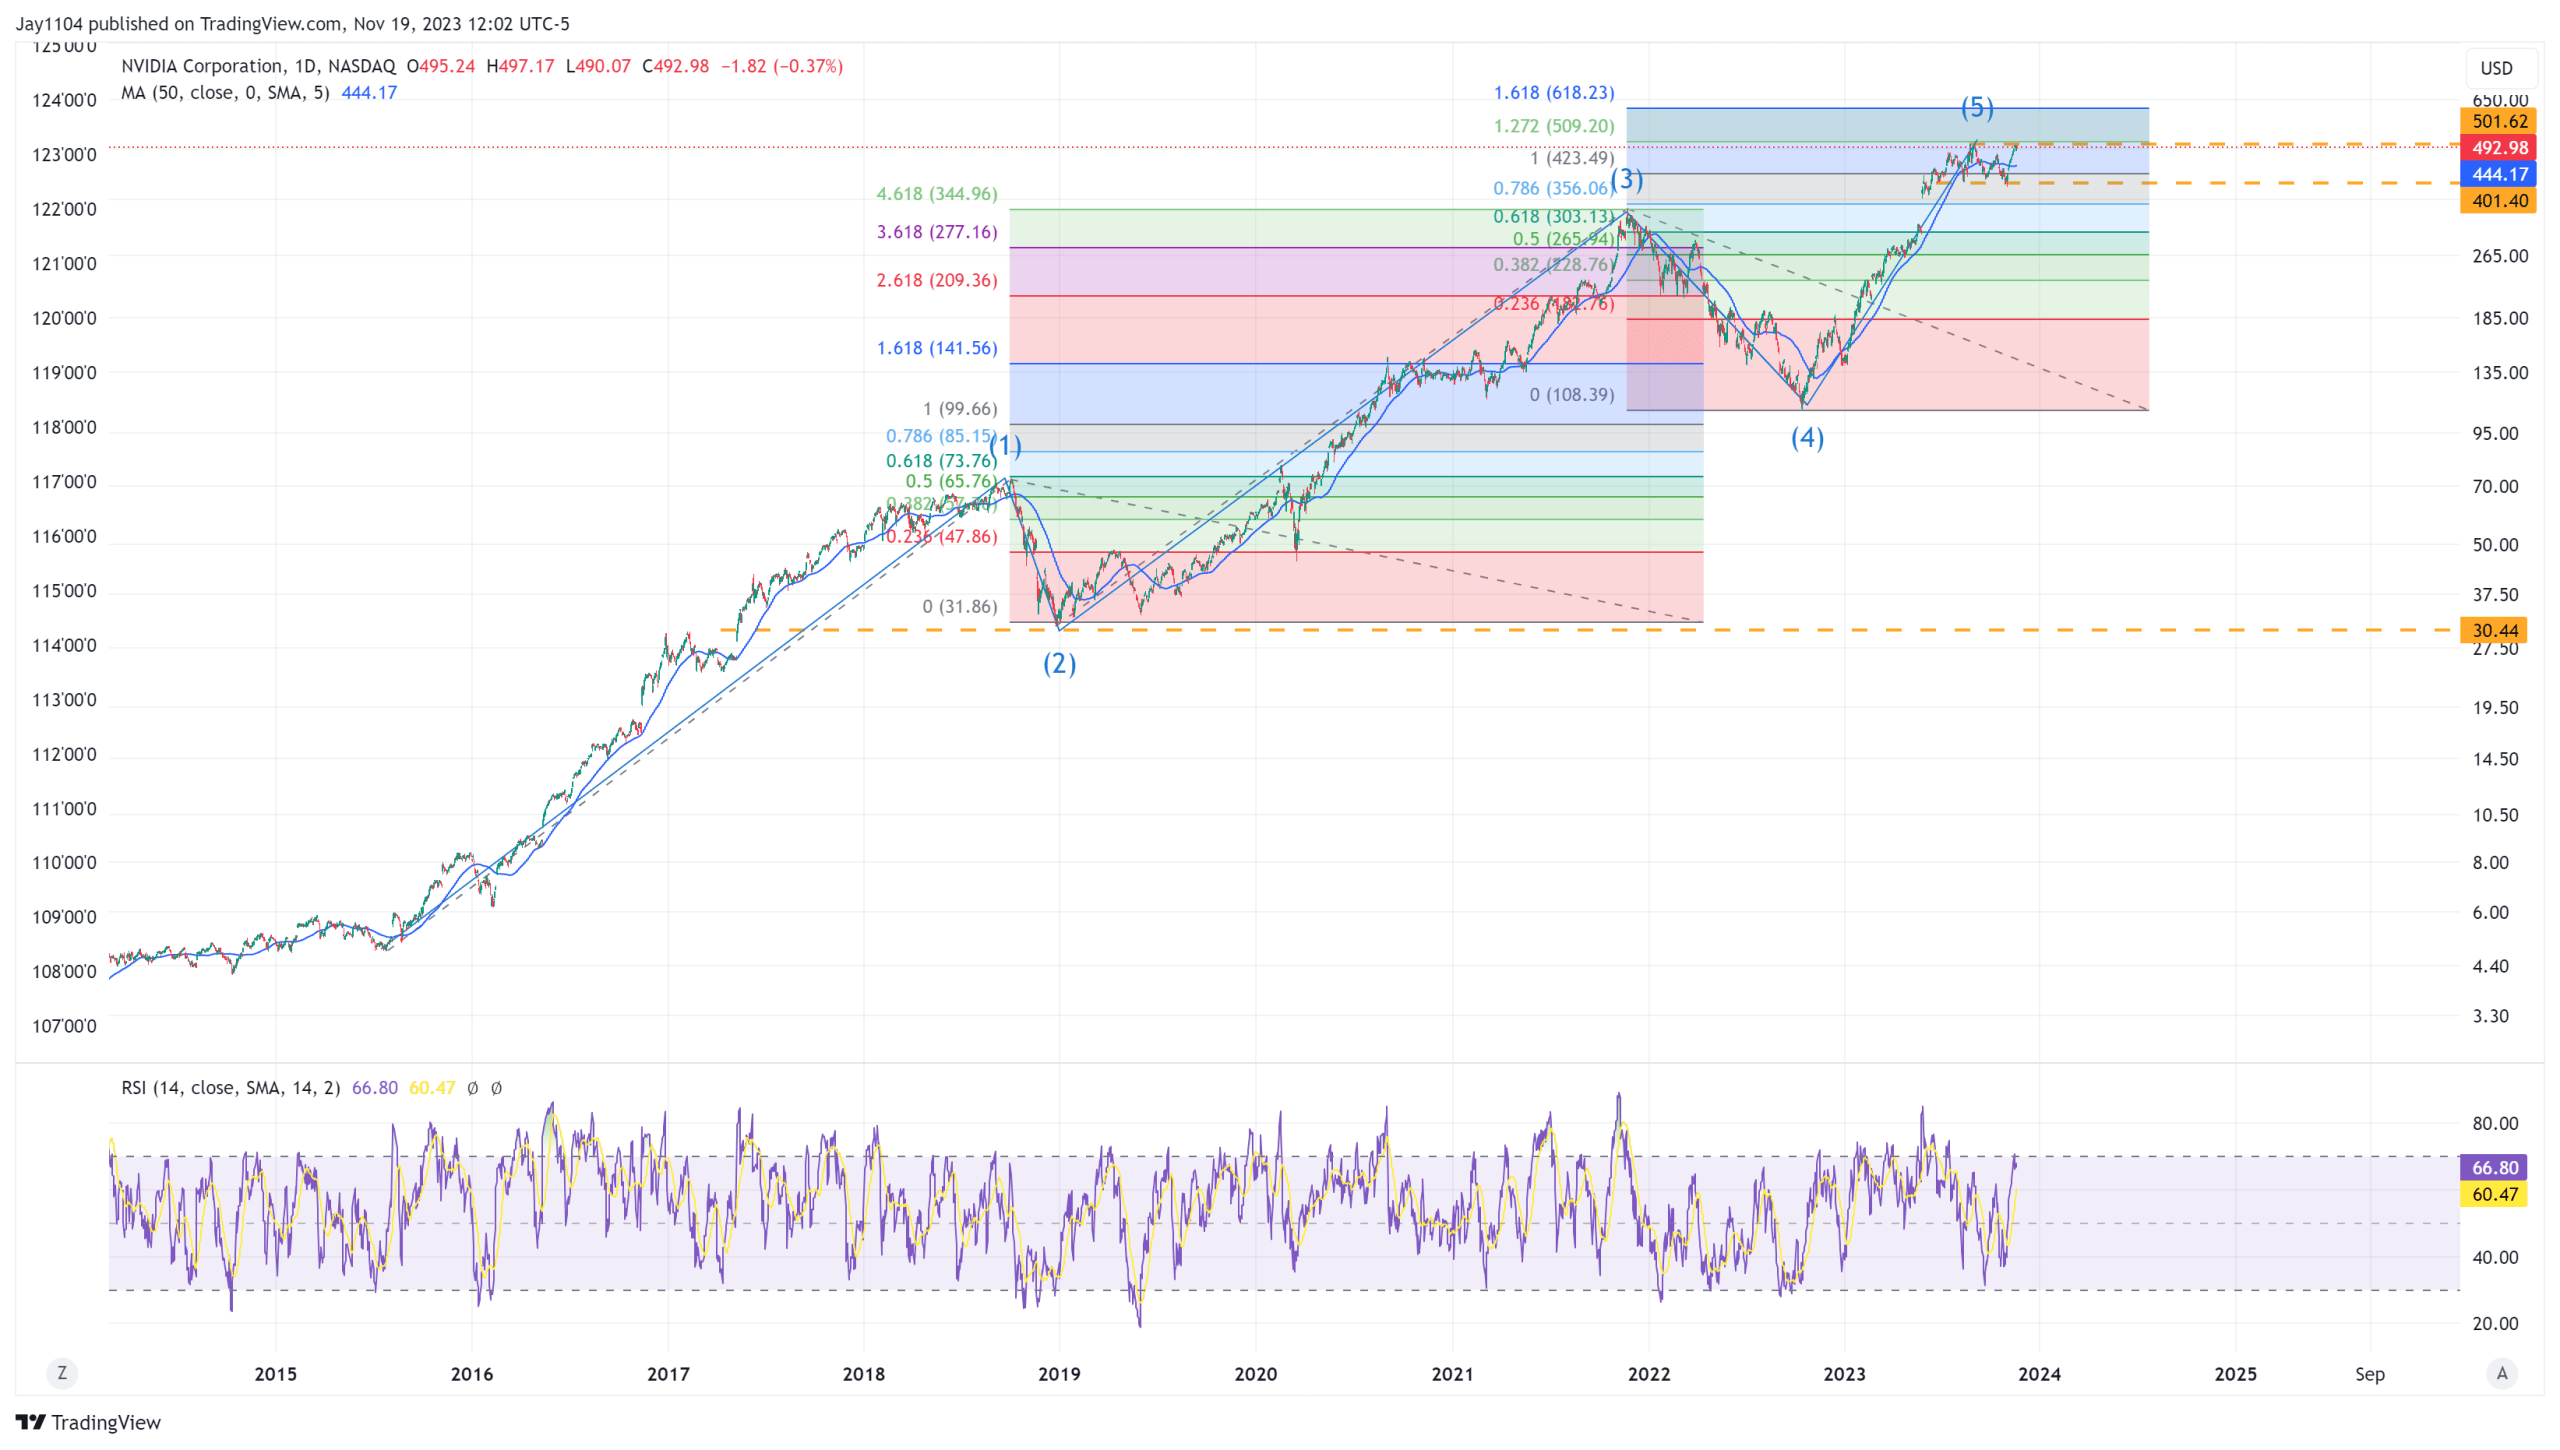 NVDA-Daily Chart
This week’s Free YouTube Video:
Anyway, good luck this week.
Original Post
Source: Investing.com


