US500
+0.80%
Add to/Remove from Watchlist
Add to Watchlist
Add Position
Position added successfully to:
Please name your holdings portfolio
Type:
BUY
SELL
Date:
Amount:
Price
Point Value:
Leverage:
1:1
1:10
1:25
1:50
1:100
1:200
1:400
1:500
1:1000
Commission:
Create New Watchlist
Create
Create a new holdings portfolio
Add
Create
+ Add another position
Close
VIX
+0.61%
Add to/Remove from Watchlist
Add to Watchlist
Add Position
Position added successfully to:
Please name your holdings portfolio
Type:
BUY
SELL
Date:
Amount:
Price
Point Value:
Leverage:
1:1
1:10
1:25
1:50
1:100
1:200
1:400
1:500
1:1000
Commission:
Create New Watchlist
Create
Create a new holdings portfolio
Add
Create
+ Add another position
Close
Yesterday was a very boring day in my view. The job report comes today, and it feels like everything I read is about November being a strong job report because of the autoworkers and screenwriters coming back to work.
I never even noticed they were gone when looking at the stats over the past few months.
Expectations are for nonfarm payrolls to rise by 183,000 in November from 150,000 in October. The unemployment rate is seen staying flat at 3.9%, while wage growth ticks lower to 4.0% from 4.1%.
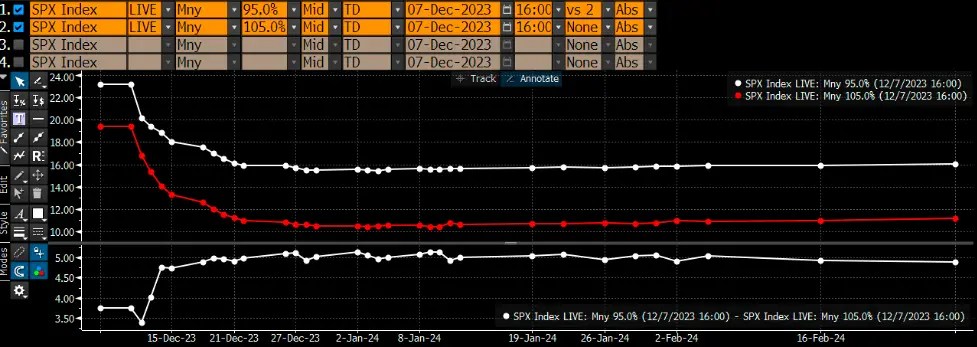
The equity market doesn’t seem very concerned with a VIX around 13, but the IV for today’s expiration is around 17%, and it is then expected to drop to around 10.5% on Monday.
So, implied volatility for today is higher, but even at 17, it doesn’t seem overly high.
 SPX Index Volatility Chart
At least from the standpoint of the options market, it looks like the S&P 500 105% options are trading with tighter implied volatility to the 95% moneyness options for today’s print, and then the spread normalizes starting next week.
There appears to be a desire to own calls into today’s report.
 SPX Index Chart
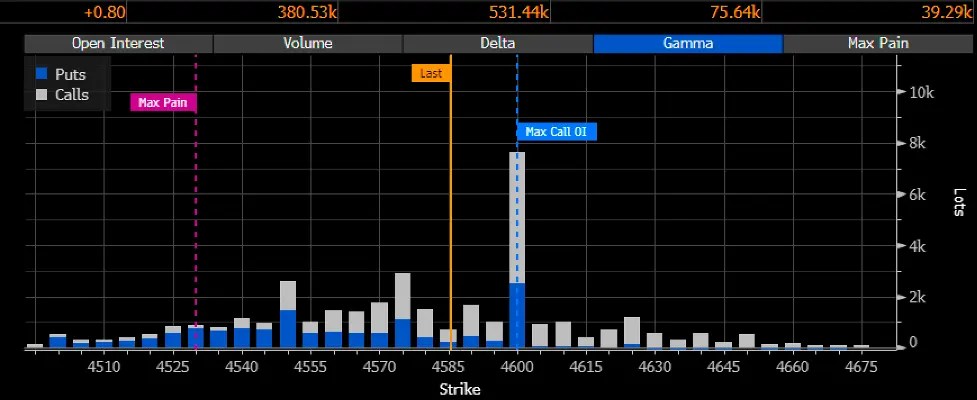
But there appears to be a lot more call gamma on the board than put gamma, and the 4,600 level appears to be a wall, which may act to hold the index in place through Opex next Friday because that 4,600 level has a lot of gamma built up around it.
 SPX Put Gamma Chart
So while it appears that traders are betting on the higher index, at least based on the options positioning for today and heading into next week, there is nowhere to go.
It could change if the payroll report somehow stuns the market higher, but I’m not sure what a stunning report would look like. Maybe just 150k jobs were created or something.
Anything higher than the estimates would probably push rates higher, and anything less than 100k would not be a good indication for the economy. So we will have to wait and see.
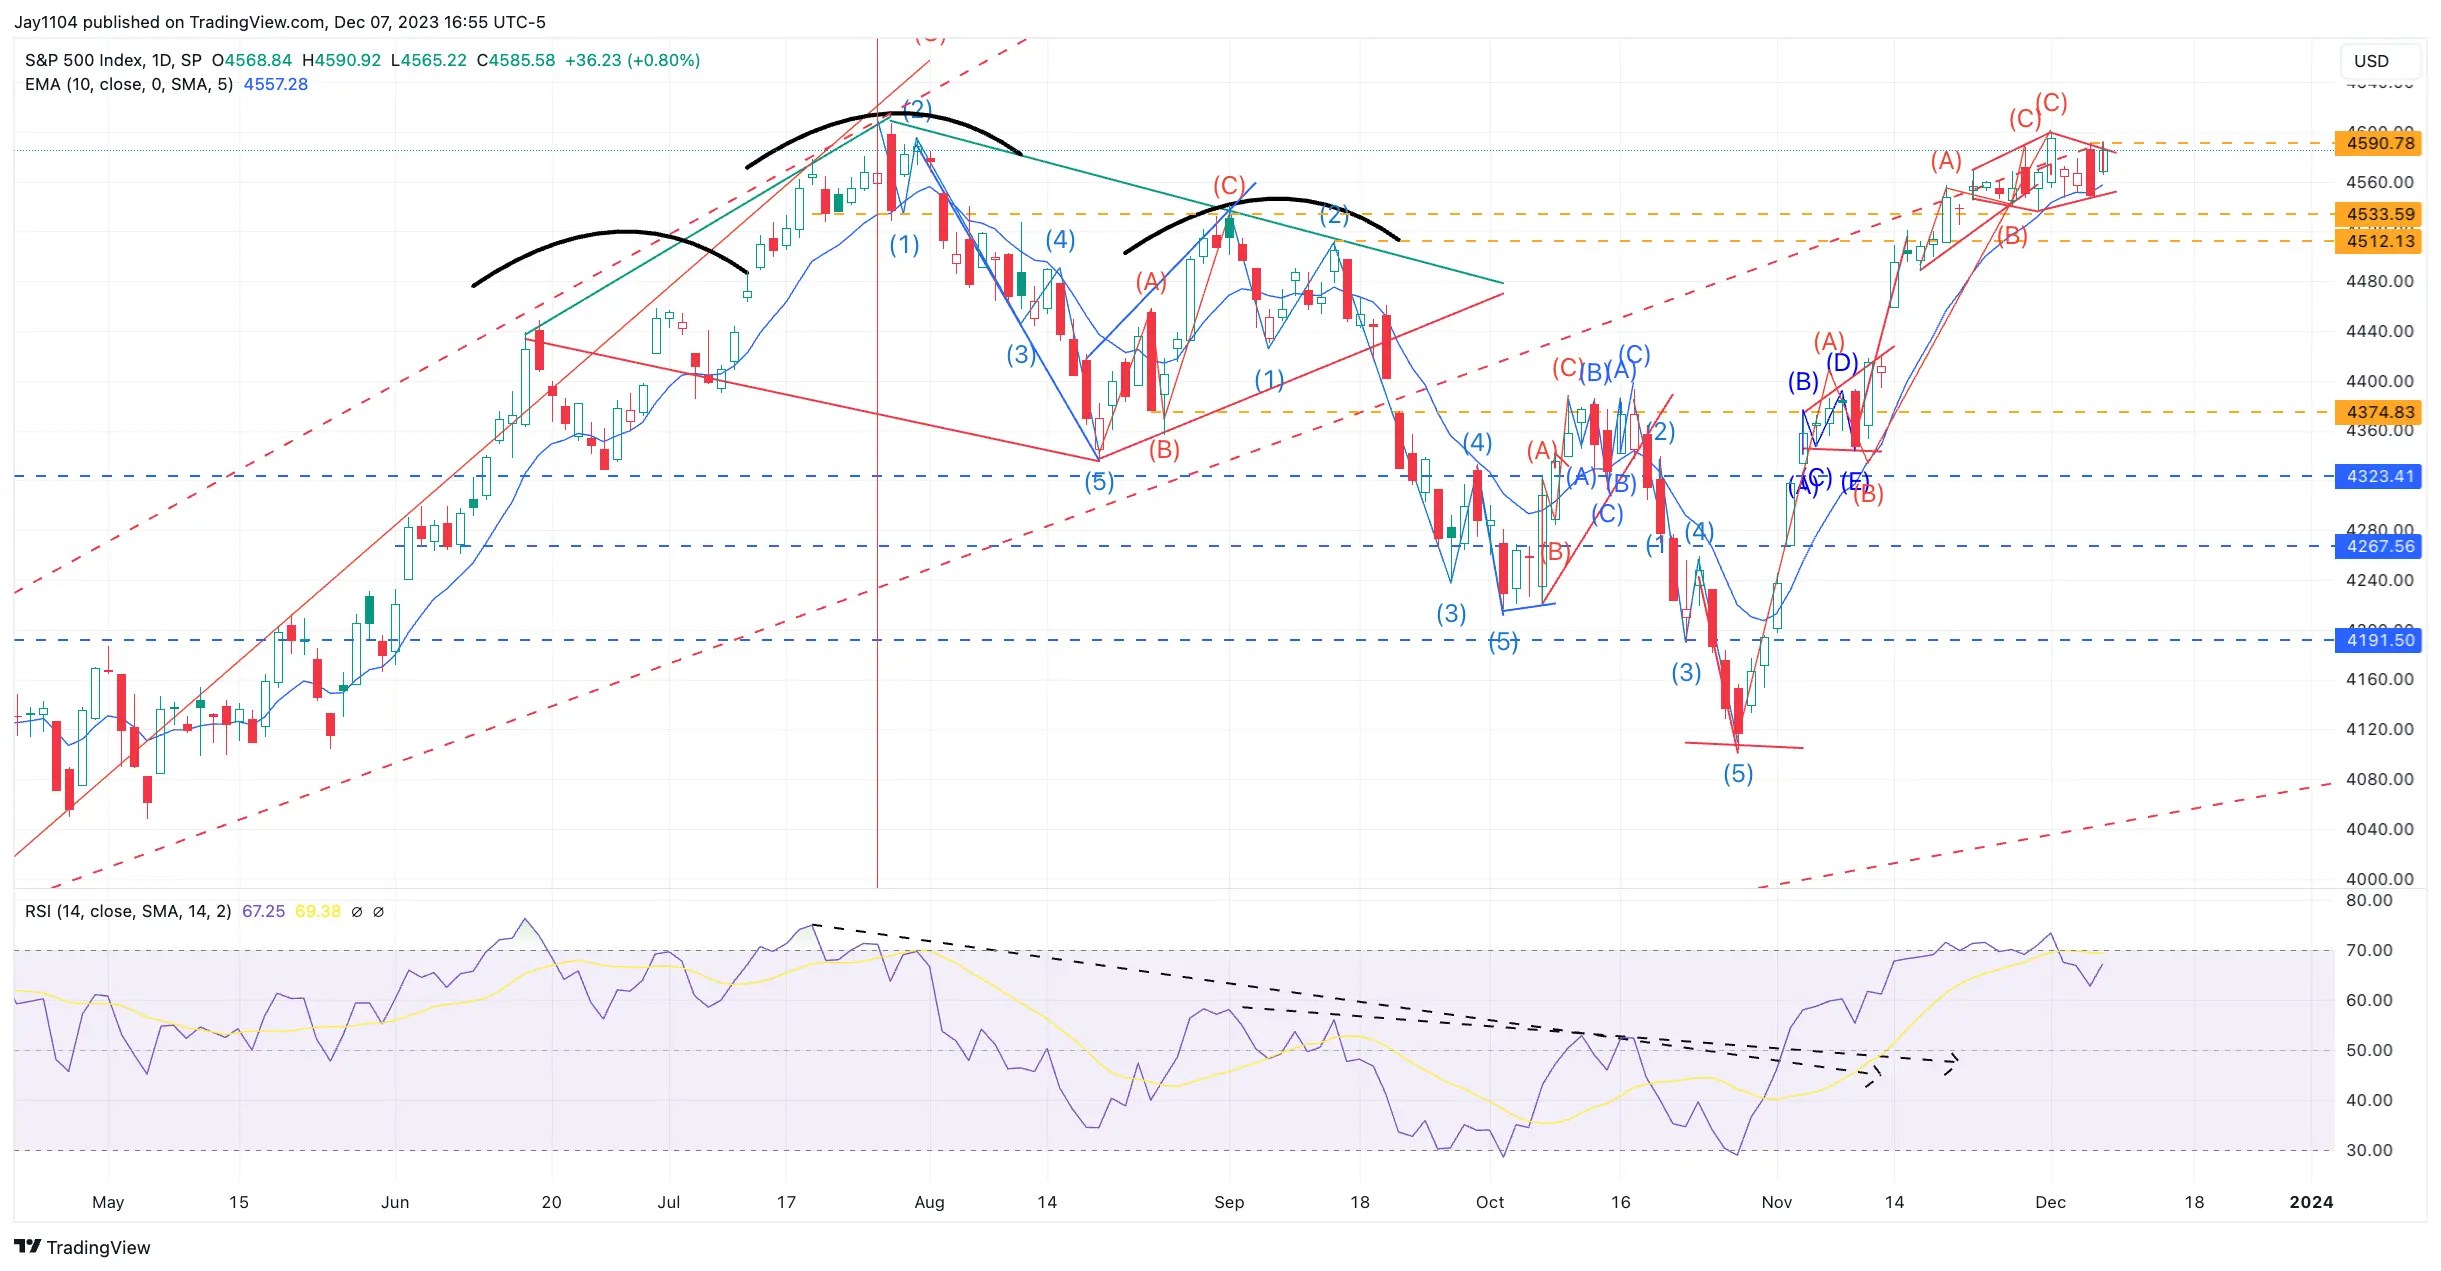
So far, at least the index hasn’t moved beyond last week’s high, and that is, at this point, the only thing that is keeping my count alive.
If we move beyond last week’s high, that would mean the July high would be challenged, and that would mean my count is wrong.
Optically, it looks like 5 waves are down in July and three waves up starting in October.
The nice thing about Elliott wave is that you are right until you are wrong, and then you can fix the count to make it all work again so that you look like you were right. It’s one of the main reasons I do not like it.
 SPX Index-Daily Chart
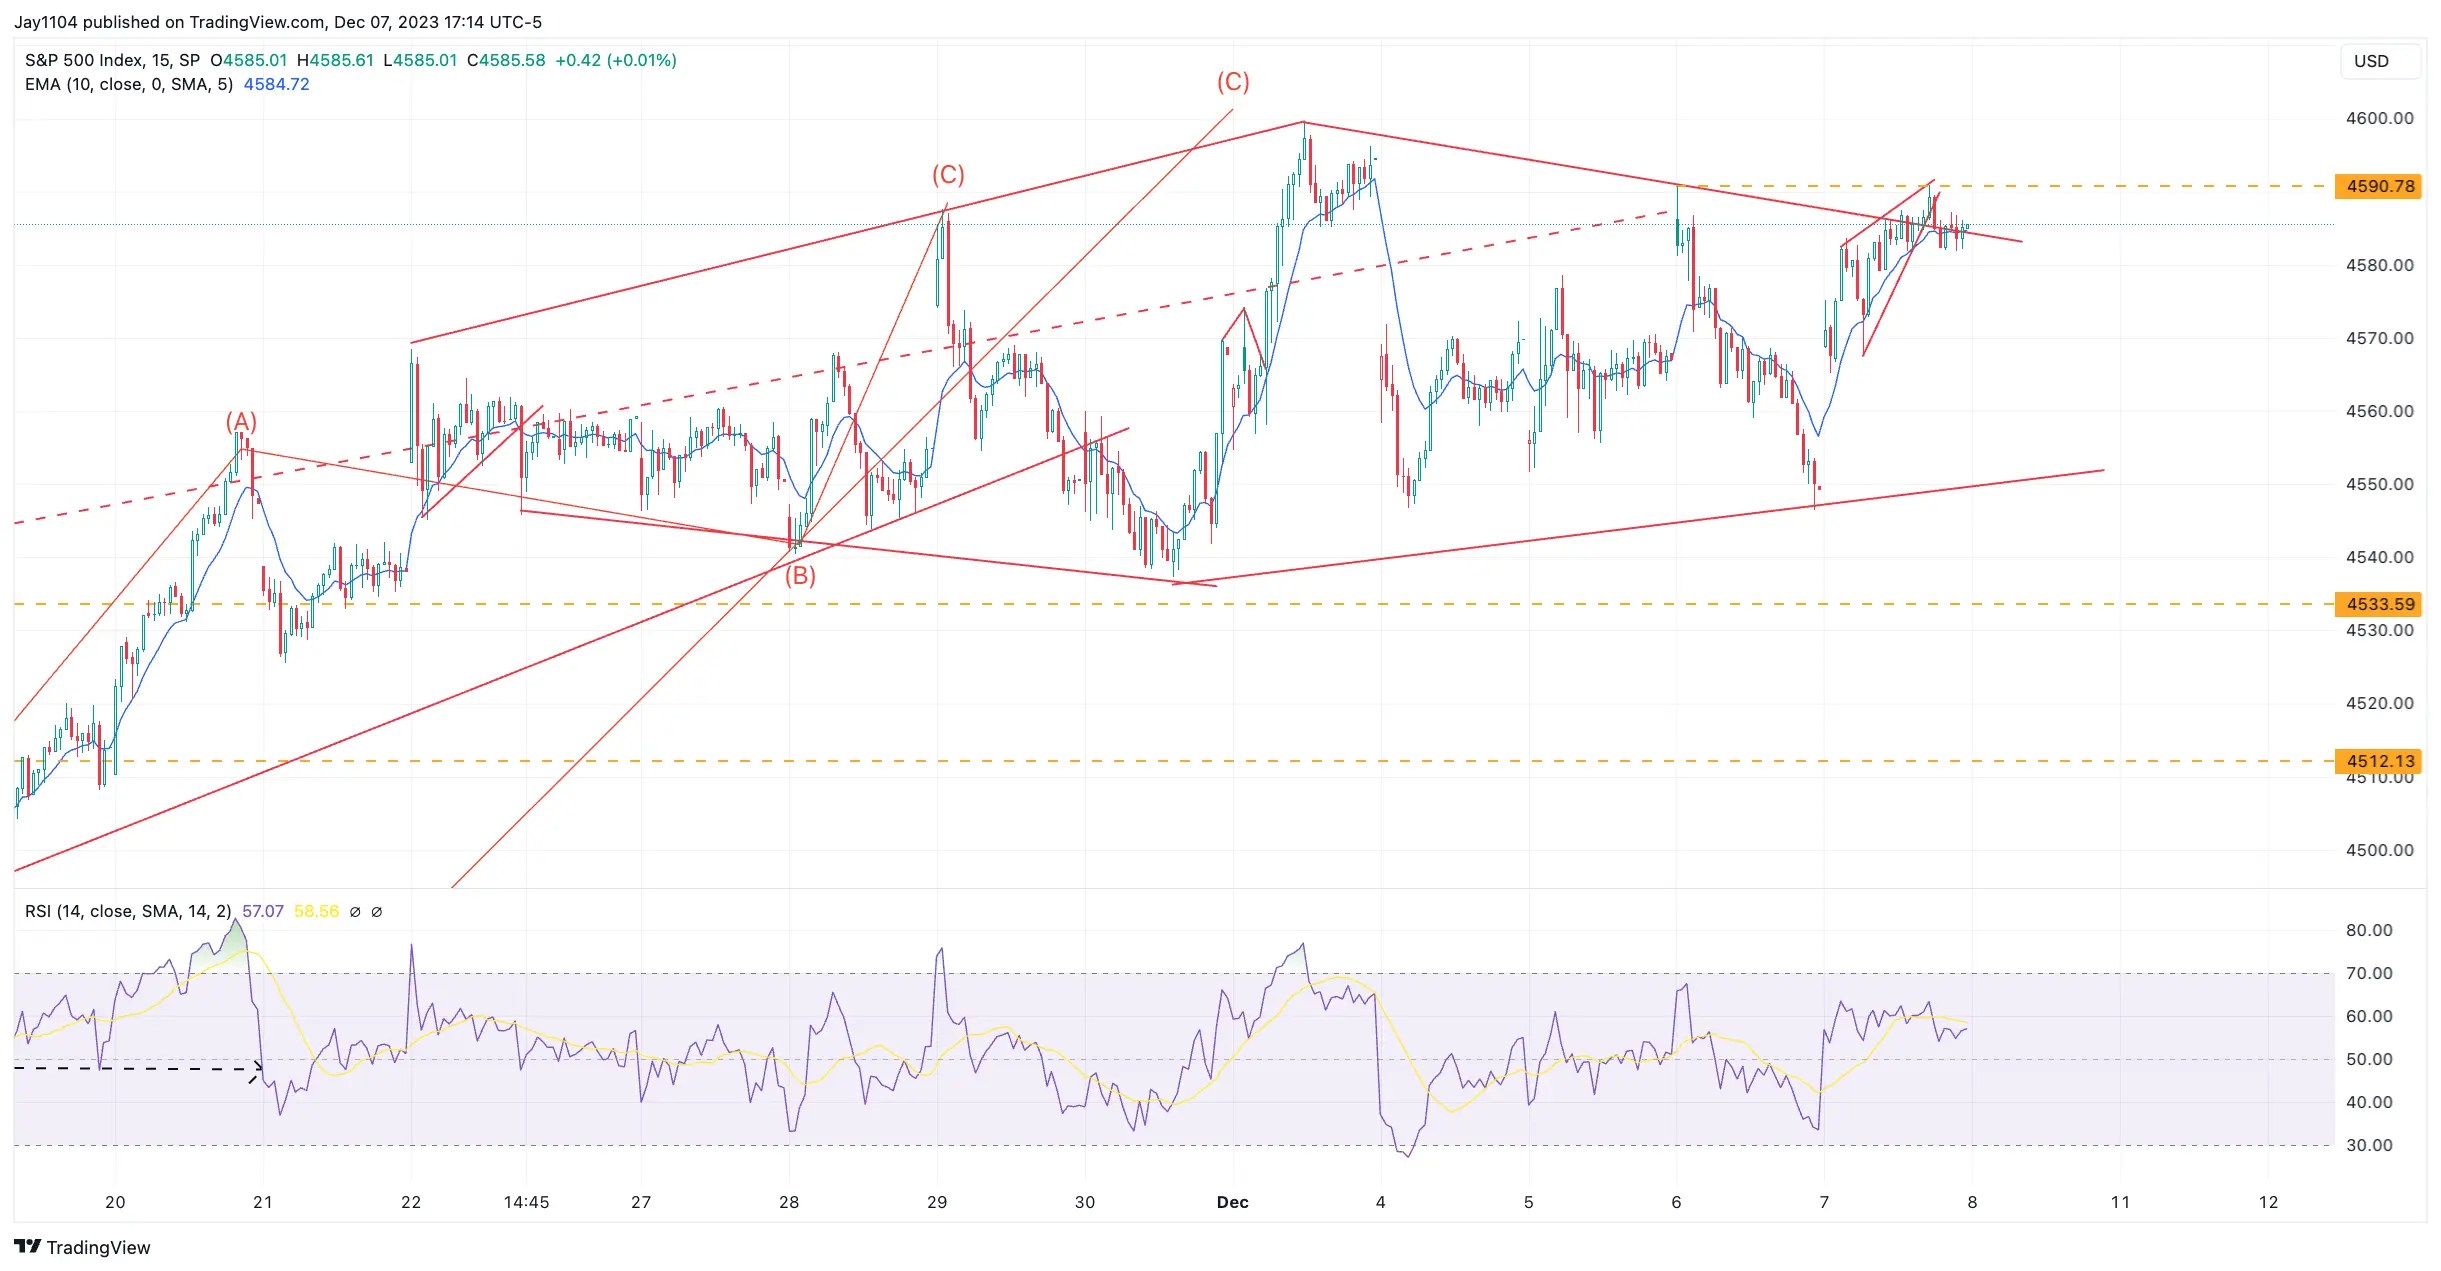
The gap from yesterday’s close could be filled quickly, And the index still looks like it is consolidating. It still looks like a diamond pattern after adjusting for yesterday’s decline, which now tells us there wasn’t a break of the pattern, yet.
 SPX 15-Minute Chart
The VIX is also consolidating similarly to the S&P 500, which supports the S&P 500 chart above.
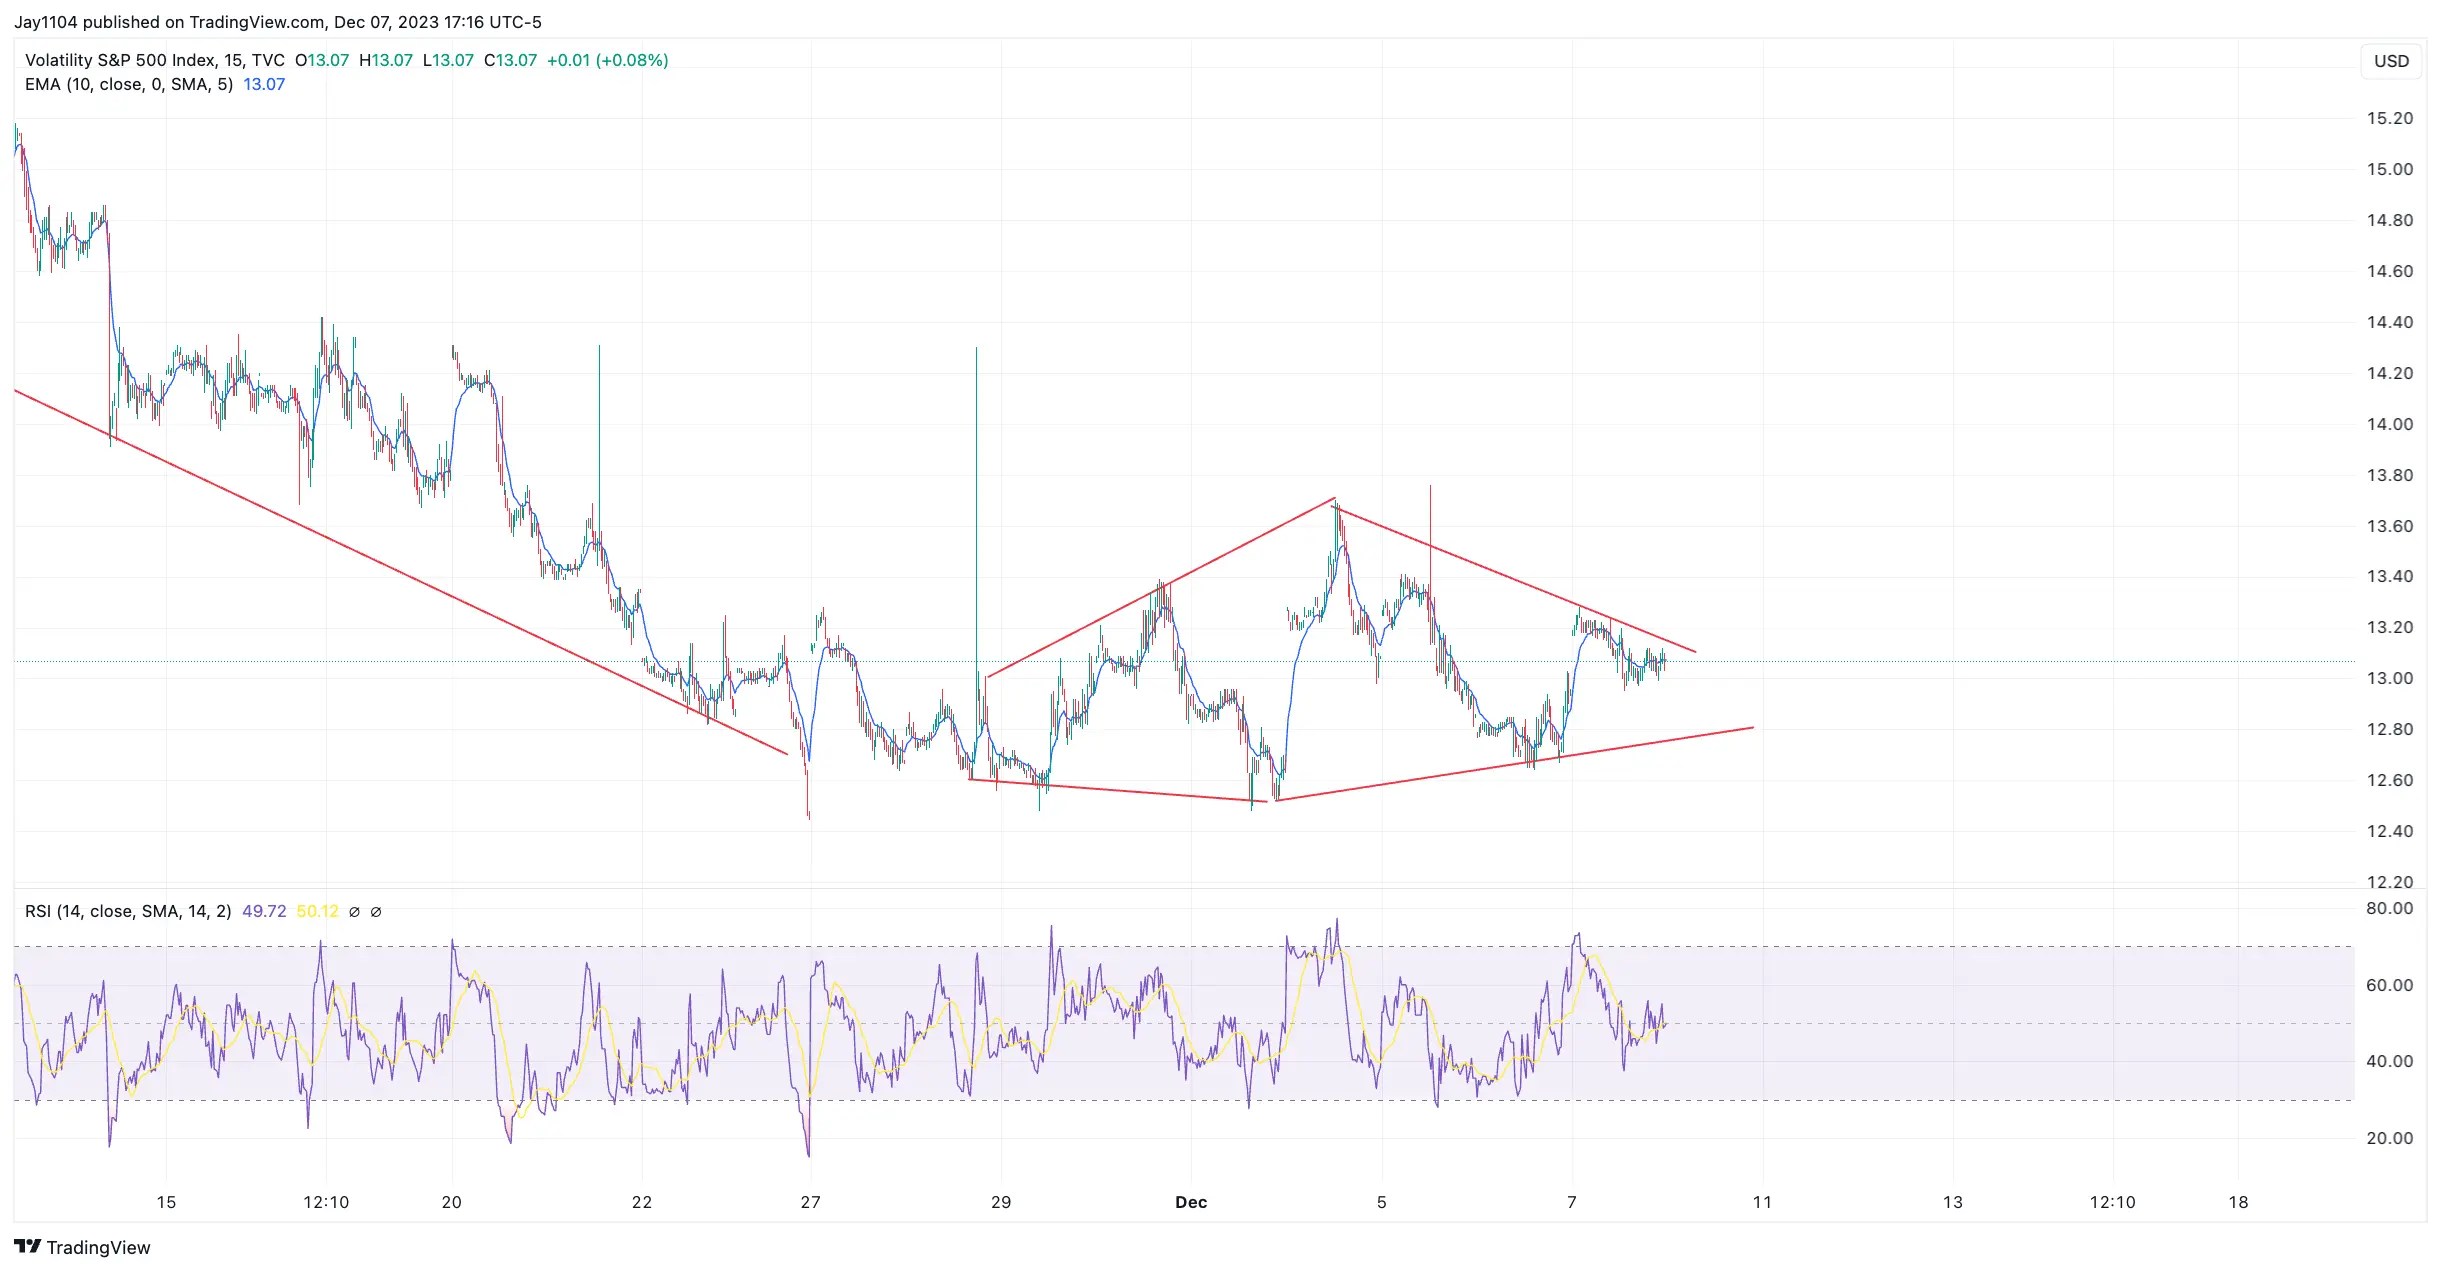 VIX-15-Minute Chart
We will see what today brings. The equity market needs a print that will be just right; anything too hot or cold won’t work this time.
Original Post
Source: Investing.com


