US500
-0.28%
Add to/Remove from Watchlist
Add to Watchlist
Add Position
Position added successfully to:
Please name your holdings portfolio
Type:
BUY
SELL
Date:
Amount:
Price
Point Value:
Leverage:
1:1
1:10
1:25
1:50
1:100
1:200
1:400
1:500
1:1000
Commission:
Create New Watchlist
Create
Create a new holdings portfolio
Add
Create
+ Add another position
Close
VIX
0.00%
Add to/Remove from Watchlist
Add to Watchlist
Add Position
Position added successfully to:
Please name your holdings portfolio
Type:
BUY
SELL
Date:
Amount:
Price
Point Value:
Leverage:
1:1
1:10
1:25
1:50
1:100
1:200
1:400
1:500
1:1000
Commission:
Create New Watchlist
Create
Create a new holdings portfolio
Add
Create
+ Add another position
Close
I took half a day off today to spend time with my family, and I did family things in New York City in the rain.
However, I paid attention to the day’s main points and understood what was happening. It appears that today has turned into a mini-monthly opex and could serve as a mini-turning point.
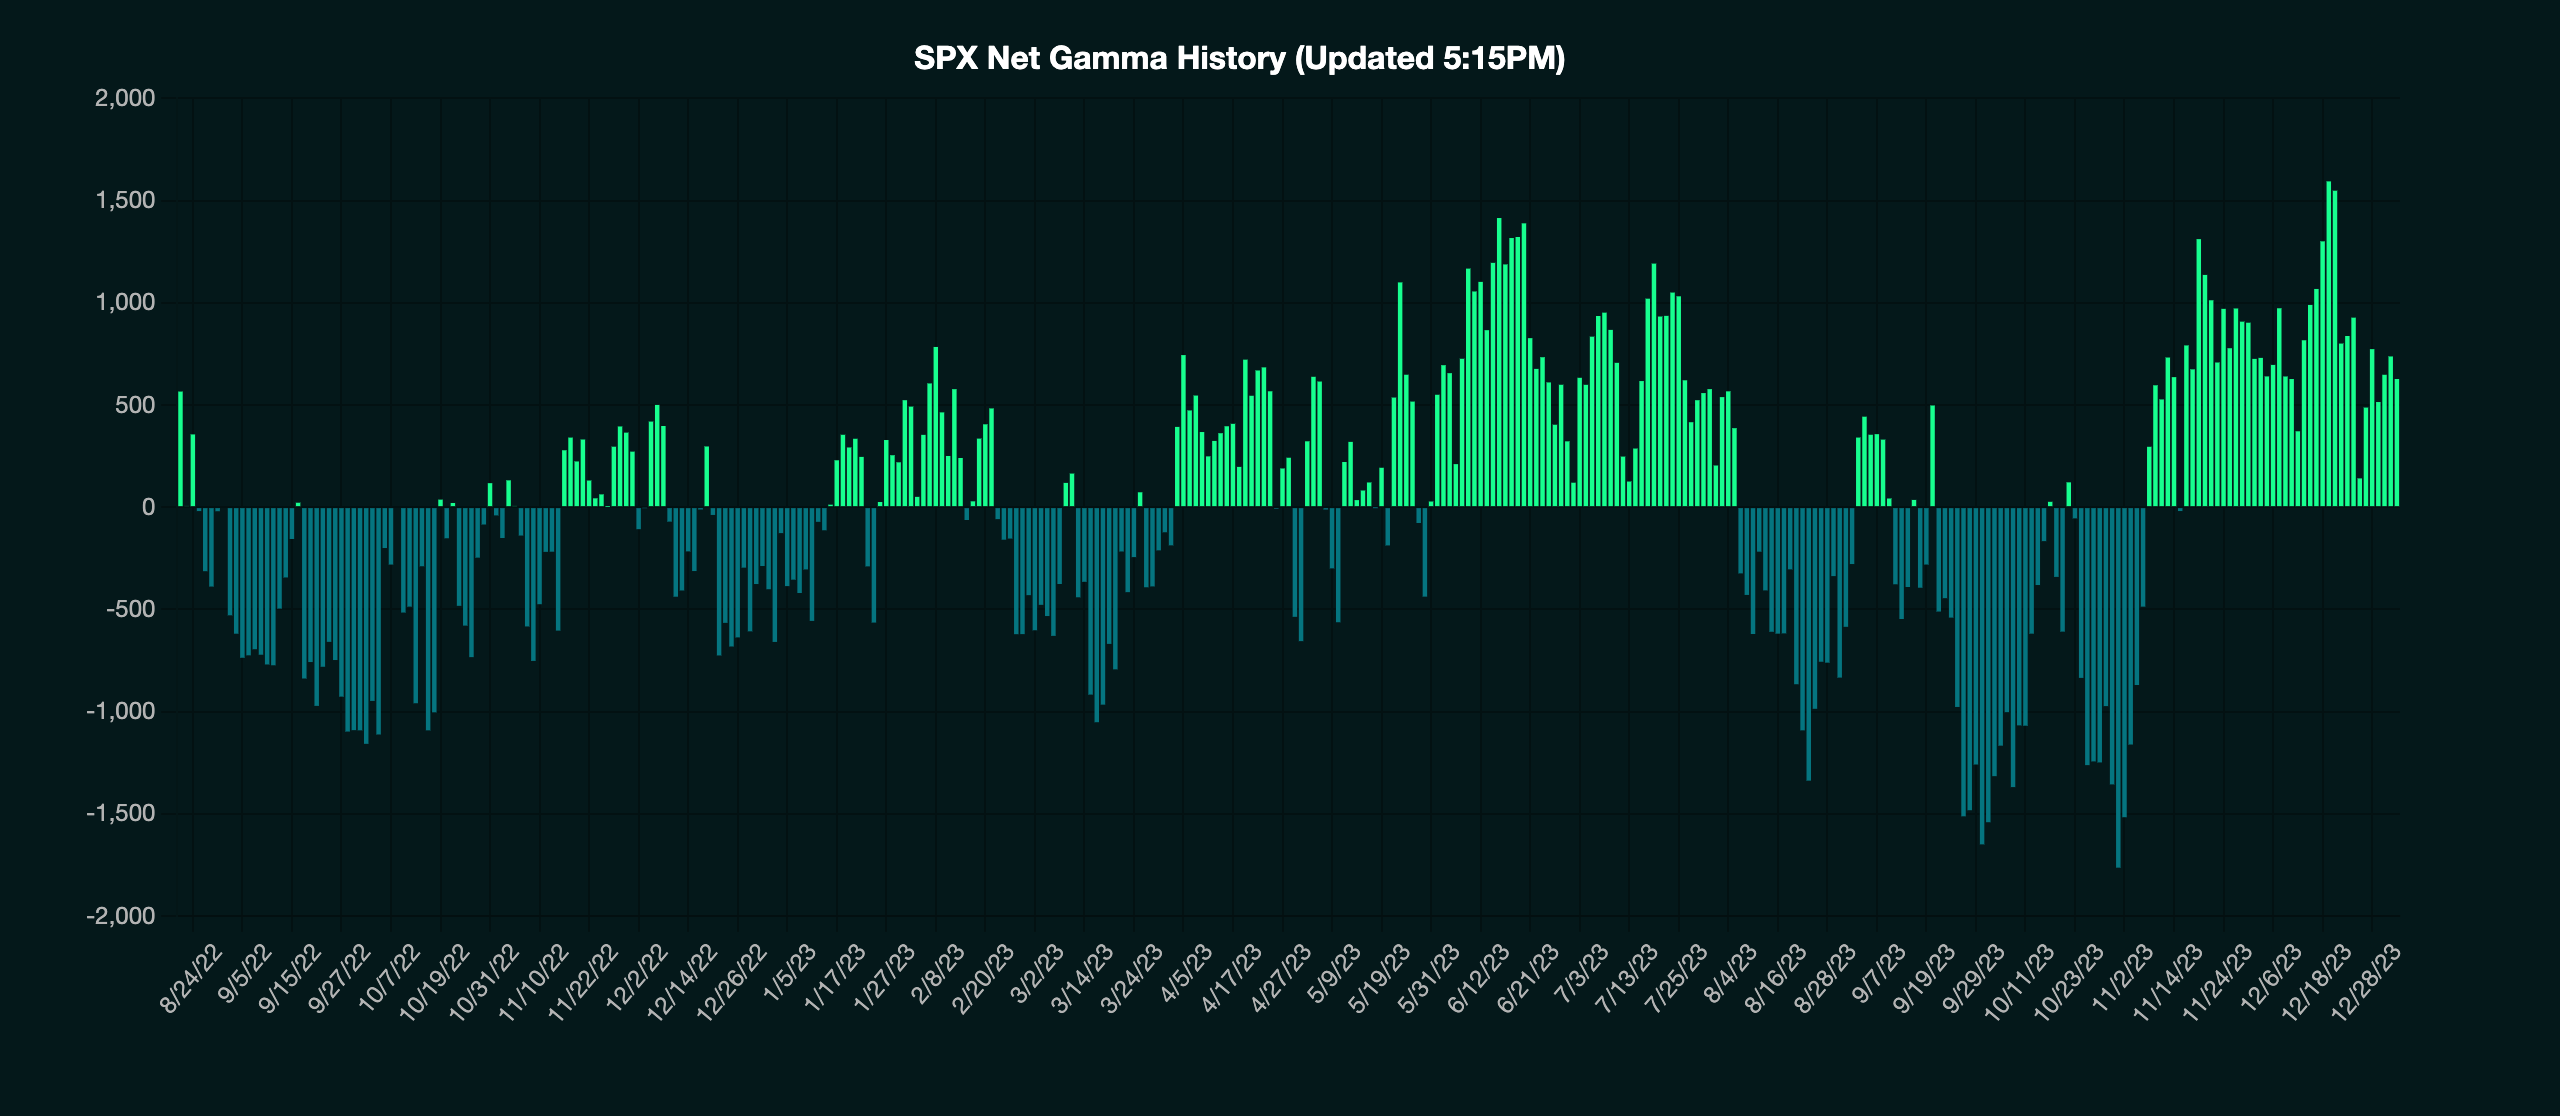
According to Gammlabs, the net gamma in the S&P 500 right now is about $625 billion, and today, 33% percent will expire, or $207 billion.
All things being equal, the total gamma should be $418 billion after today, down from a sizeable $1.5 trillion at the December 15 opex.
As gamma levels in the S&P 500 fall, the market tends to become less stable, and when it flips into negative gamma, that is when volatility picks up; the market slips into negative gamma when the S&P 500 falls below the 0 gamma level.
 SPX Net Gamma History
Source: GAMMA LABS
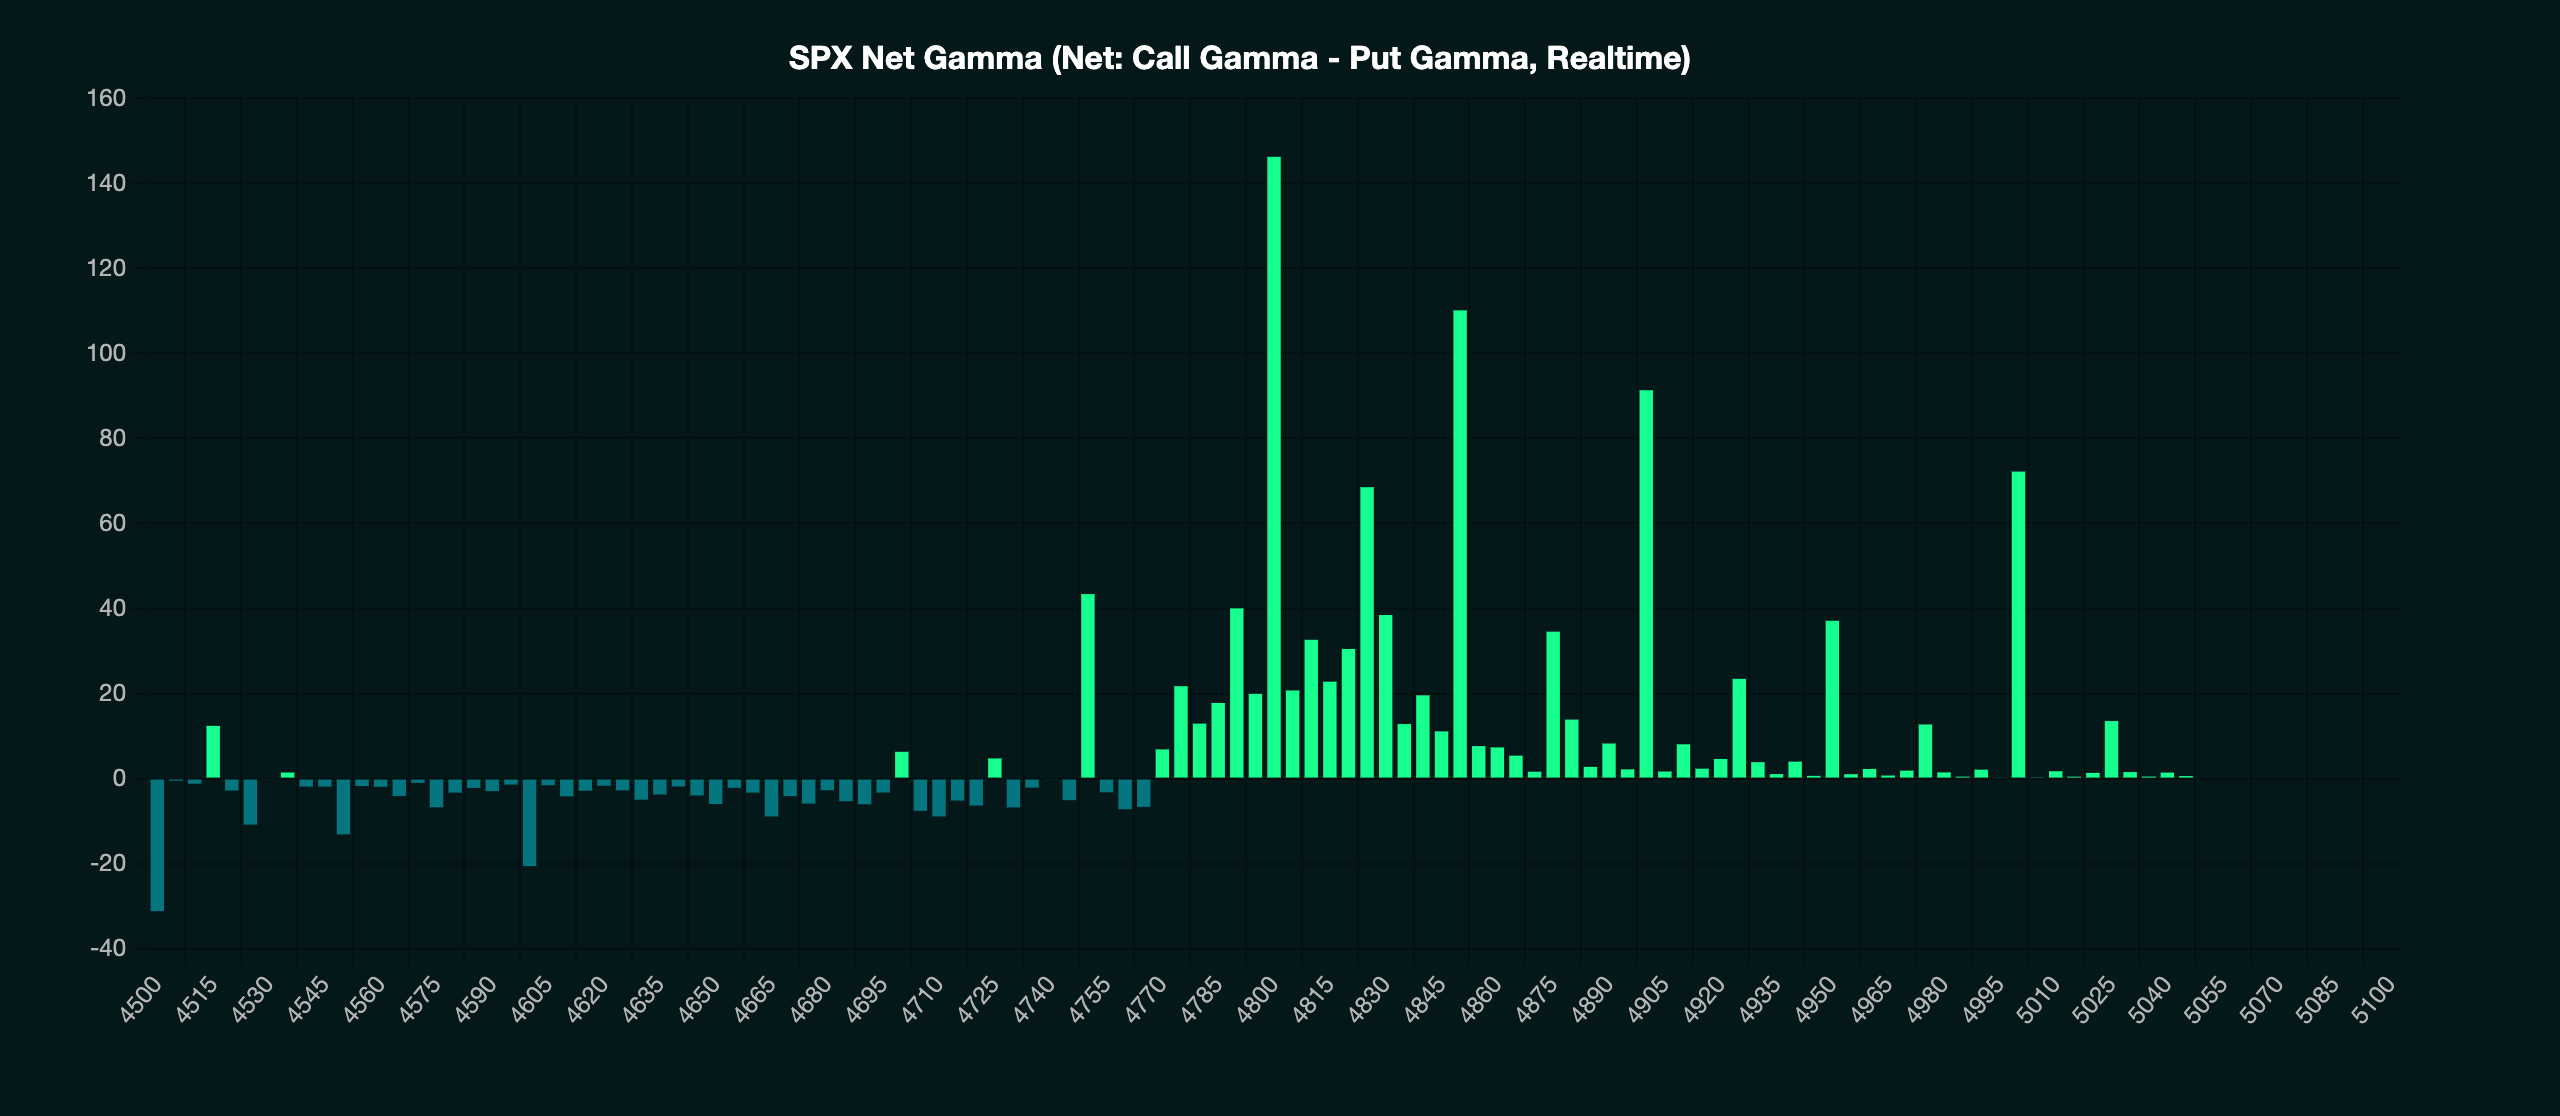
Currently, the zero gamma level is around 4,750, and the level with the largest amount of gamma comes at 4,800.
Essentially, at this point, the S&P 500 is stuck between the zero gamma level and the absolute gamma level. That is why the market has been pinned and just stuck.
 SPX Net Gamma
Source: GAMMA LABS
Also, today will be the infamous JPM collar expiration date for the call at the 4,510 strike price and the creation of a new collar for the March end date.
I have no idea how this would or could impact trading today, but generally, we can see strange and observable swings in the market during the day due to this.
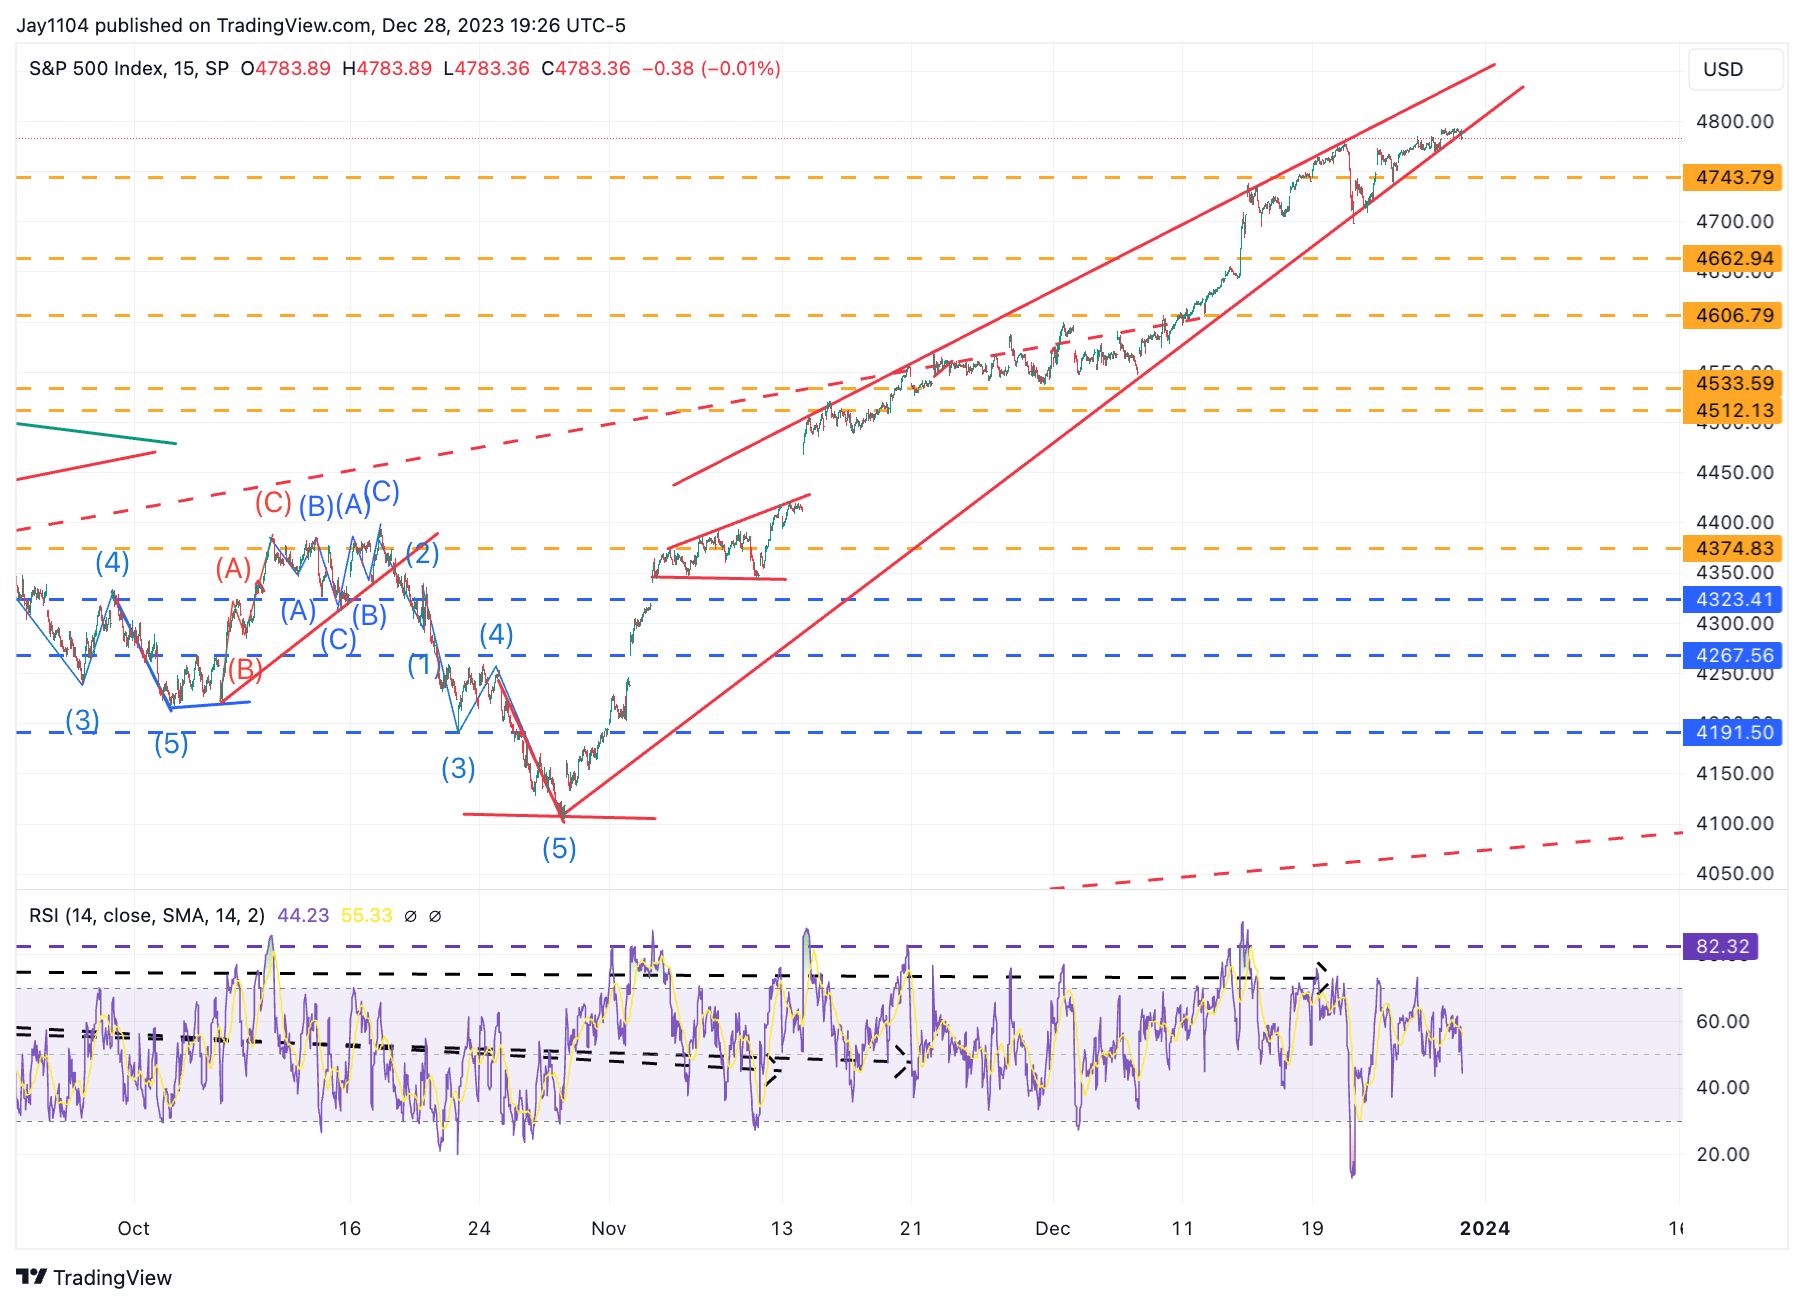
At this point, the S&P 500 is very close to breaking the rising wedge pattern.
If it breaks the pattern, the market is certainly overbought enough that we could see a sizeable move lower.
Especially given that we flip into negative gamma at 4,4750, which would increase volatility and most likely cause a spike in the VIX index, especially given how low the VIX is.
I often talk about windows of opportunities for the market, and with the year-end, today based on how the options market is positioned and the slew of data due next week.
The window of opportunity for the Bears to take the ball back will be open probably for the next week or so.
 S&P 500 Index-15-Minute Chart
Next week, things will return to normal regarding my schedule and write-ups. Until then, have a happy new year. I am looking forward to a better and more exciting 2024.
Original Post
Source: Investing.com


