NDX
+1.04%
Add to/Remove from Watchlist
Add to Watchlist
Add Position
Position added successfully to:
Please name your holdings portfolio
Type:
BUY
SELL
Date:
Amount:
Price
Point Value:
Leverage:
1:1
1:10
1:25
1:50
1:100
1:200
1:400
1:500
1:1000
Commission:
Create New Watchlist
Create
Create a new holdings portfolio
Add
Create
+ Add another position
Close
US500
+0.82%
Add to/Remove from Watchlist
Add to Watchlist
Add Position
Position added successfully to:
Please name your holdings portfolio
Type:
BUY
SELL
Date:
Amount:
Price
Point Value:
Leverage:
1:1
1:10
1:25
1:50
1:100
1:200
1:400
1:500
1:1000
Commission:
Create New Watchlist
Create
Create a new holdings portfolio
Add
Create
+ Add another position
Close
US2000
-0.20%
Add to/Remove from Watchlist
Add to Watchlist
Add Position
Position added successfully to:
Please name your holdings portfolio
Type:
BUY
SELL
Date:
Amount:
Price
Point Value:
Leverage:
1:1
1:10
1:25
1:50
1:100
1:200
1:400
1:500
1:1000
Commission:
Create New Watchlist
Create
Create a new holdings portfolio
Add
Create
+ Add another position
Close
IWM
-0.23%
Add to/Remove from Watchlist
Add to Watchlist
Add Position
Position added successfully to:
Please name your holdings portfolio
Type:
BUY
SELL
Date:
Amount:
Price
Point Value:
Leverage:
1:1
1:10
1:25
1:50
1:100
1:200
1:400
1:500
1:1000
Commission:
Create New Watchlist
Create
Create a new holdings portfolio
Add
Create
+ Add another position
Close
IXIC
+0.95%
Add to/Remove from Watchlist
Add to Watchlist
Add Position
Position added successfully to:
Please name your holdings portfolio
Type:
BUY
SELL
Date:
Amount:
Price
Point Value:
Leverage:
1:1
1:10
1:25
1:50
1:100
1:200
1:400
1:500
1:1000
Commission:
Create New Watchlist
Create
Create a new holdings portfolio
Add
Create
+ Add another position
Close
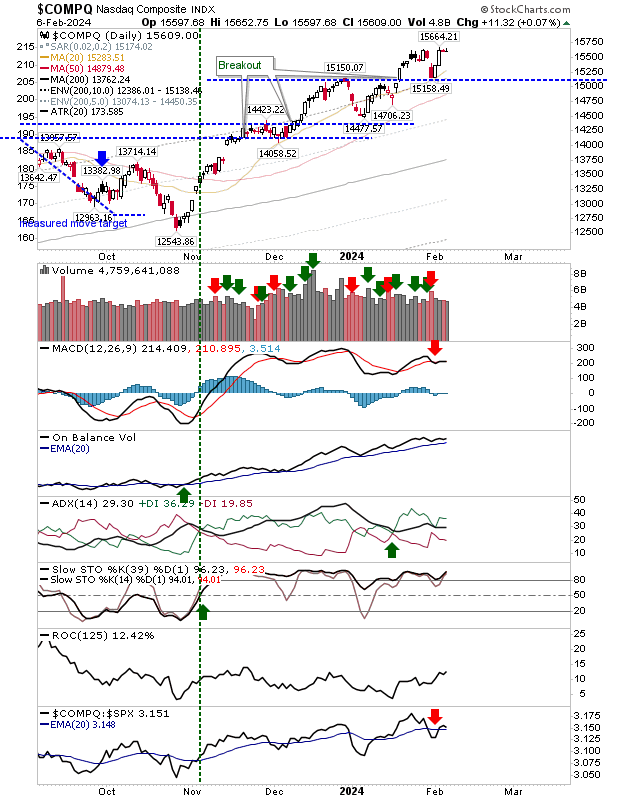
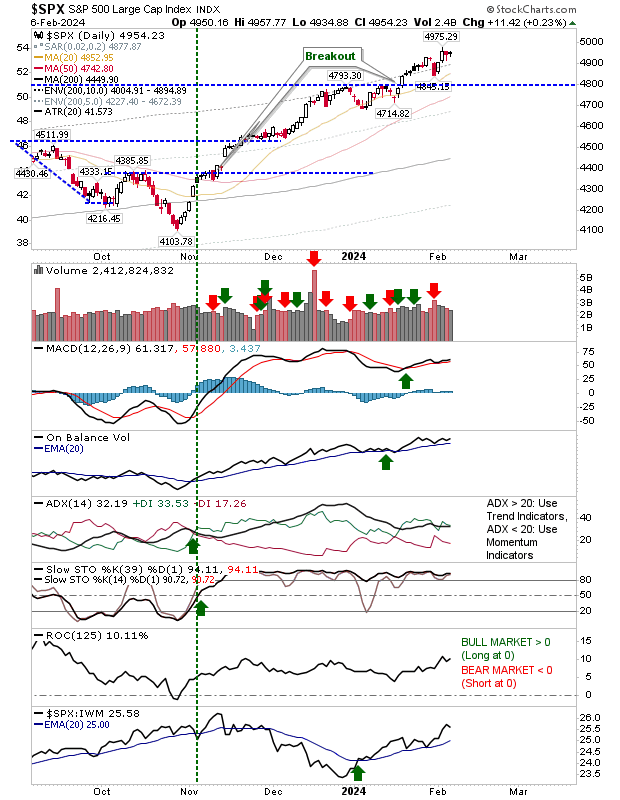
A bit of a non-event for the S&P 500 and Nasdaq as both indexes closed with tight doji near their highs. There isn’t a whole lot more to add for these indexes.
 COMPQ-Daily Chart
 SPX-Daily Chart
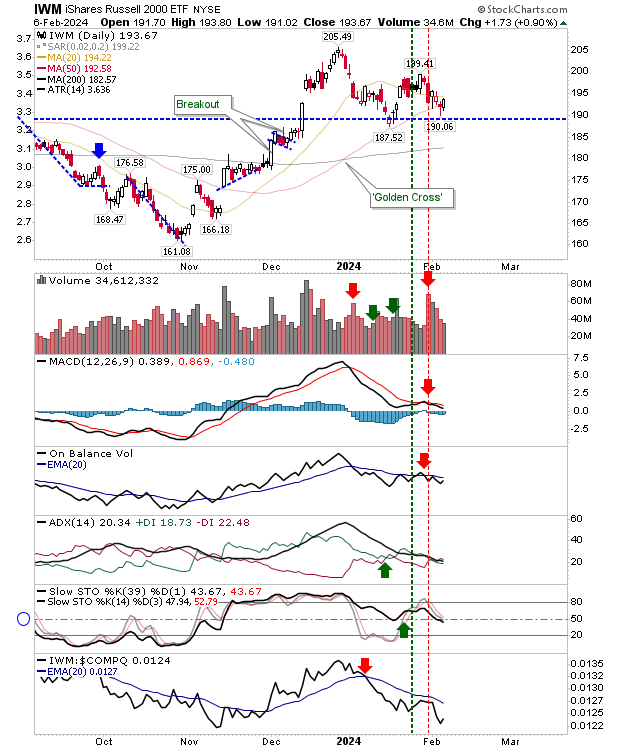
The Russell 2000 (IWM managed to deliver a little more upside with a successful test of its 50-day MA. However, the volume was well down on what I would like to see for a successful support test.
 IWM-Daily Chart
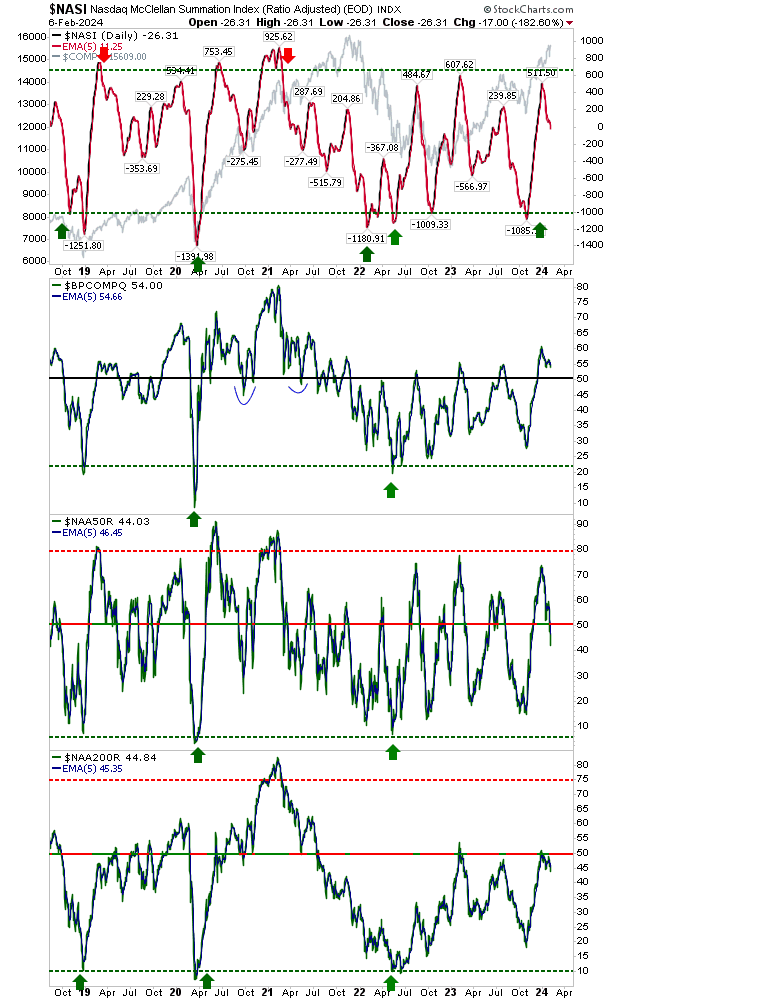
I follow J.C. Parets and he has noted the breadth weakness in this rally.
This is apparent in the Percentage of (Nasdaq) Stocks above the 50-day MA, 200-day MA, Bullish Percents Index, and Summation Index, all of which are showing a bearish divergence.
 NASI-Daily Chart
Given the breadth picture (in the Nasdaq), the expectation is that tight trading will eventually give way to selling, or catch bulls off guard with a ‘bull trap’. I would expect this selling to spill across indexes, but let’s see what the market brings.
Source: Investing.com


