NDX
+0.95%
Add to/Remove from Watchlist
Add to Watchlist
Add Position
Position added successfully to:
Please name your holdings portfolio
Type:
BUY
SELL
Date:
Amount:
Price
Point Value:
Leverage:
1:1
1:10
1:25
1:50
1:100
1:200
1:400
1:500
1:1000
Commission:
Create New Watchlist
Create
Create a new holdings portfolio
Add
Create
+ Add another position
Close
US500
+0.52%
Add to/Remove from Watchlist
Add to Watchlist
Add Position
Position added successfully to:
Please name your holdings portfolio
Type:
BUY
SELL
Date:
Amount:
Price
Point Value:
Leverage:
1:1
1:10
1:25
1:50
1:100
1:200
1:400
1:500
1:1000
Commission:
Create New Watchlist
Create
Create a new holdings portfolio
Add
Create
+ Add another position
Close
NVDA
+1.87%
Add to/Remove from Watchlist
Add to Watchlist
Add Position
Position added successfully to:
Please name your holdings portfolio
Type:
BUY
SELL
Date:
Amount:
Price
Point Value:
Leverage:
1:1
1:10
1:25
1:50
1:100
1:200
1:400
1:500
1:1000
Commission:
Create New Watchlist
Create
Create a new holdings portfolio
Add
Create
+ Add another position
Close
DX
-0.02%
Add to/Remove from Watchlist
Add to Watchlist
Add Position
Position added successfully to:
Please name your holdings portfolio
Type:
BUY
SELL
Date:
Amount:
Price
Point Value:
Leverage:
1:1
1:10
1:25
1:50
1:100
1:200
1:400
1:500
1:1000
Commission:
Create New Watchlist
Create
Create a new holdings portfolio
Add
Create
+ Add another position
Close
SMH
+2.19%
Add to/Remove from Watchlist
Add to Watchlist
Add Position
Position added successfully to:
Please name your holdings portfolio
Type:
BUY
SELL
Date:
Amount:
Price
Point Value:
Leverage:
1:1
1:10
1:25
1:50
1:100
1:200
1:400
1:500
1:1000
Commission:
Create New Watchlist
Create
Create a new holdings portfolio
Add
Create
+ Add another position
Close
DXY
-0.06%
Add to/Remove from Watchlist
Add to Watchlist
Add Position
Position added successfully to:
Please name your holdings portfolio
Type:
BUY
SELL
Date:
Amount:
Price
Point Value:
Leverage:
1:1
1:10
1:25
1:50
1:100
1:200
1:400
1:500
1:1000
Commission:
Create New Watchlist
Create
Create a new holdings portfolio
Add
Create
+ Add another position
Close
Stocks finished the day higher, with some wild moves in the final minutes on a $4.1 billion buy imbalance, sending the Nasdaq 100 up almost 1% and the S&P 500 up about 50 bps.
The ramp higher started around 3 PM ET, which isn’t surprising given the size of the imbalance.
Closing imbalances start accumulating at 2 PM ET, so if you can see those imbalances build, then some may try to front-run that imbalance, which appears to have happened here, and today was the month’s end.
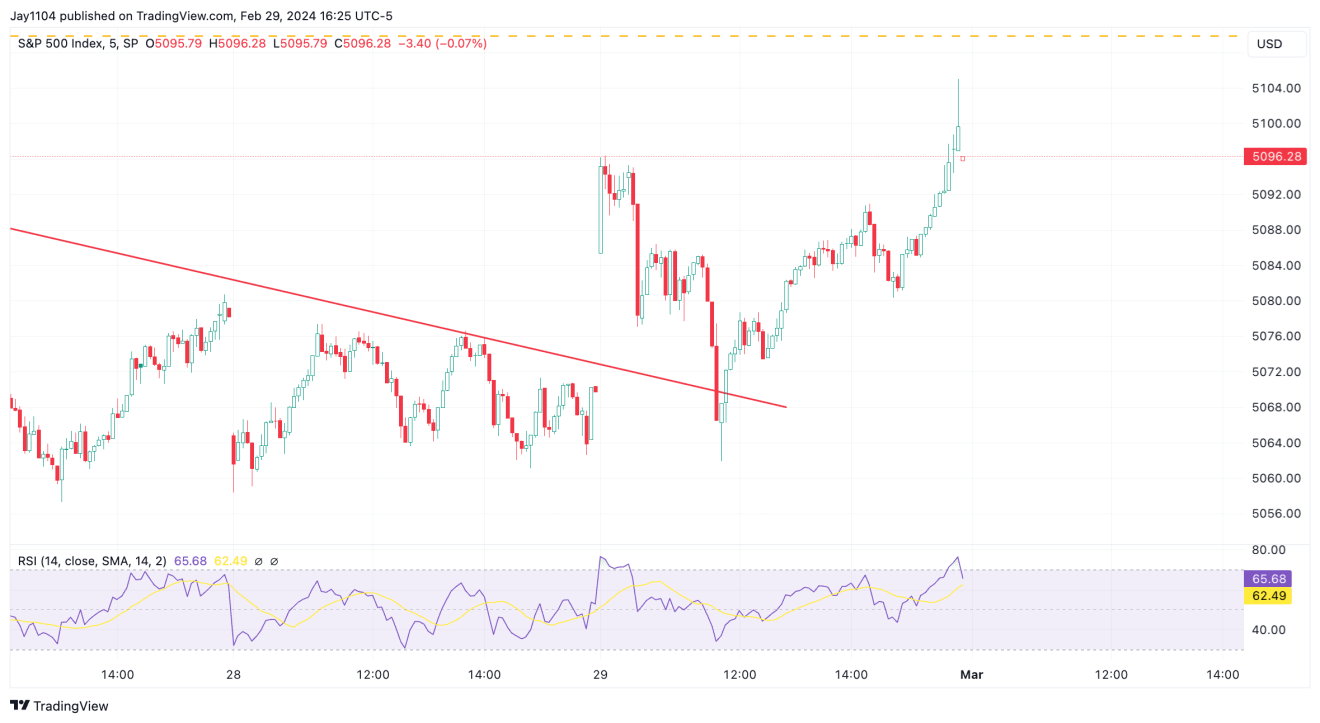 S&P 500 Index-5-Minute Chart
I have been paying attention mainly to the Nasdaq over the last two weeks because it has been relatively easy to get a feel for what is happening with support and resistance.
At this point, not much has changed. The NDX did manage to close at the upper end of the trading range, which has been pretty well defined between 17,850 and 18,050.
At this point, it seems pretty easy because if the Nasdaq gaps higher today, resistance is broken, which, given where the Bollinger bands are, suggests an upside to 18,150 or, potentially, the upper end of the broadening wedge around 18,450.
If the index breaks lower, support comes at 18,040 and then at 17,475.
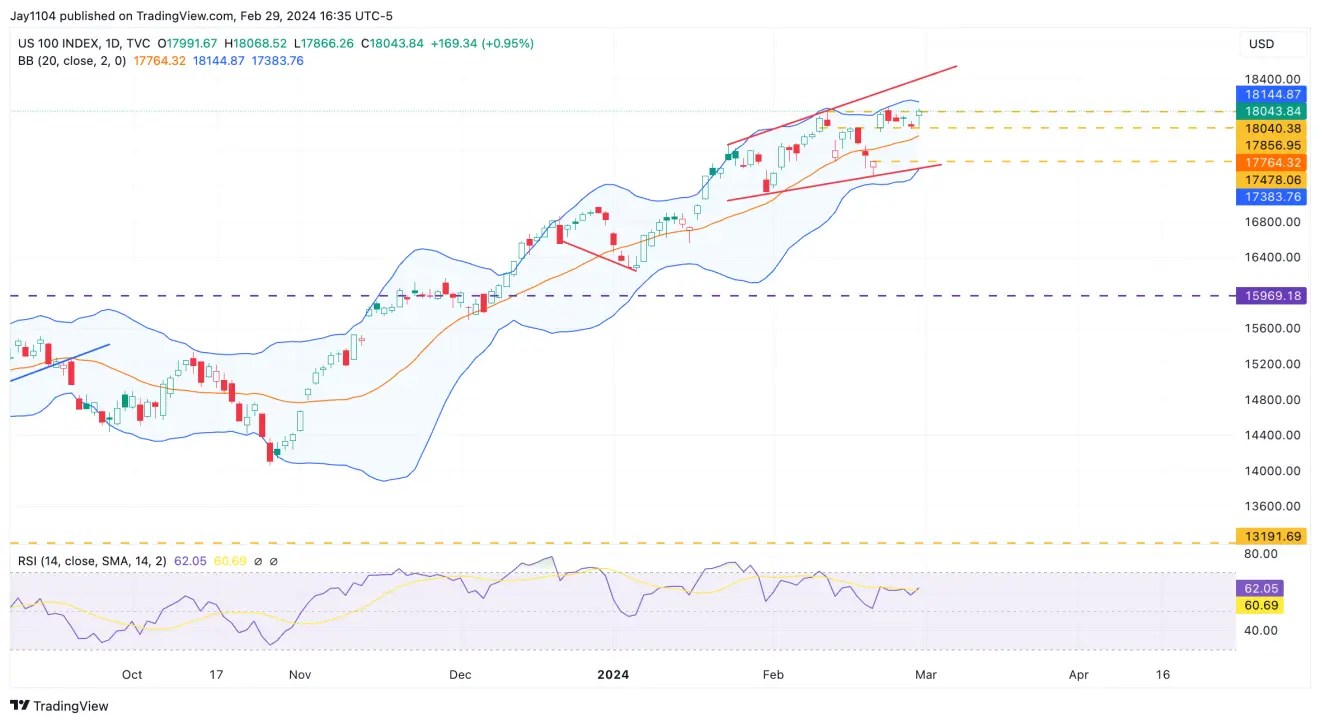 NDQ-100-Daily Chart
The dollar rose today following the inline PCE report, and at this point, the DXY has been able to break above resistance at 104.25 until we see something meaningful happen with the dollar; it is tough to see the stock market caving, and that is because financial conditions just aren’t tightening enough to bring stocks down.
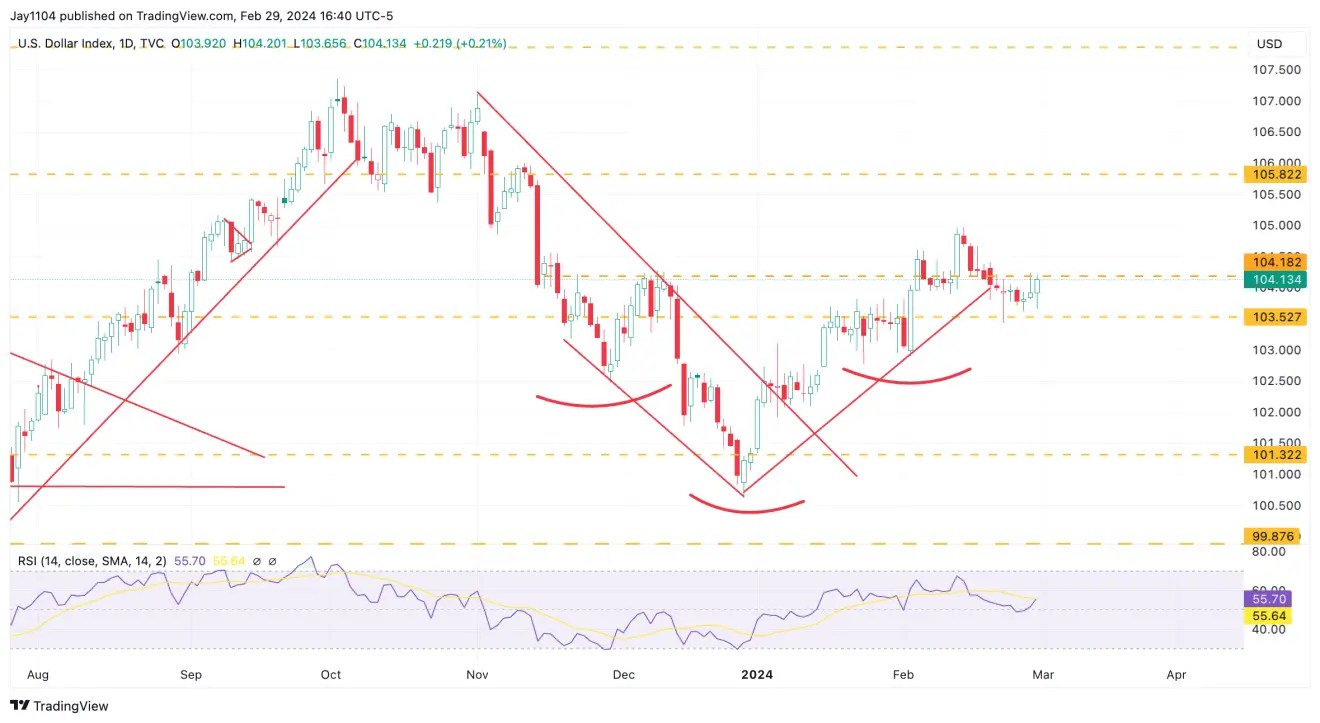 US Dollar Index-Daily Chart
Meanwhile, the inflation swaps market must not have liked what it saw in the PCE report, and based on some “preliminary” data I am seeing, CPI swaps for June are now trading at 3.06% from the previous level of 2.9%. But I won’t be able to confirm that until today, so I will probably update that over the weekend. But the market is saying a year goes by with headline CPI y/y stuck at 3% or higher.
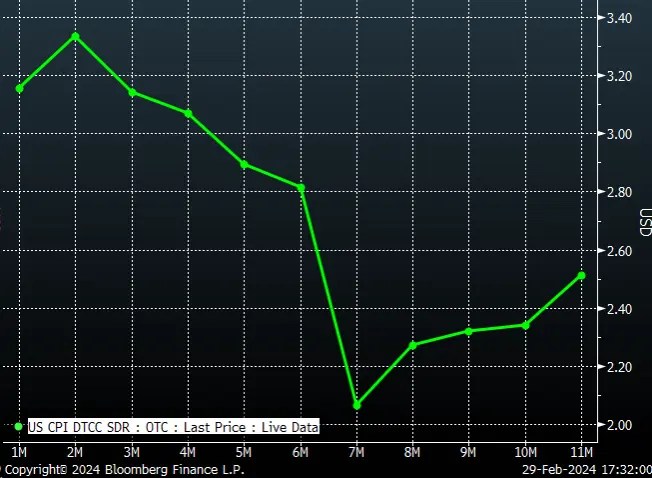 Inflation Swaps
Nvidia (Nasdaq:NVDA) can not get beyond the $800 level because the call wall is still there and hasn’t been rolled higher. The stock went up and touched that price today, and that is where it stopped once again.
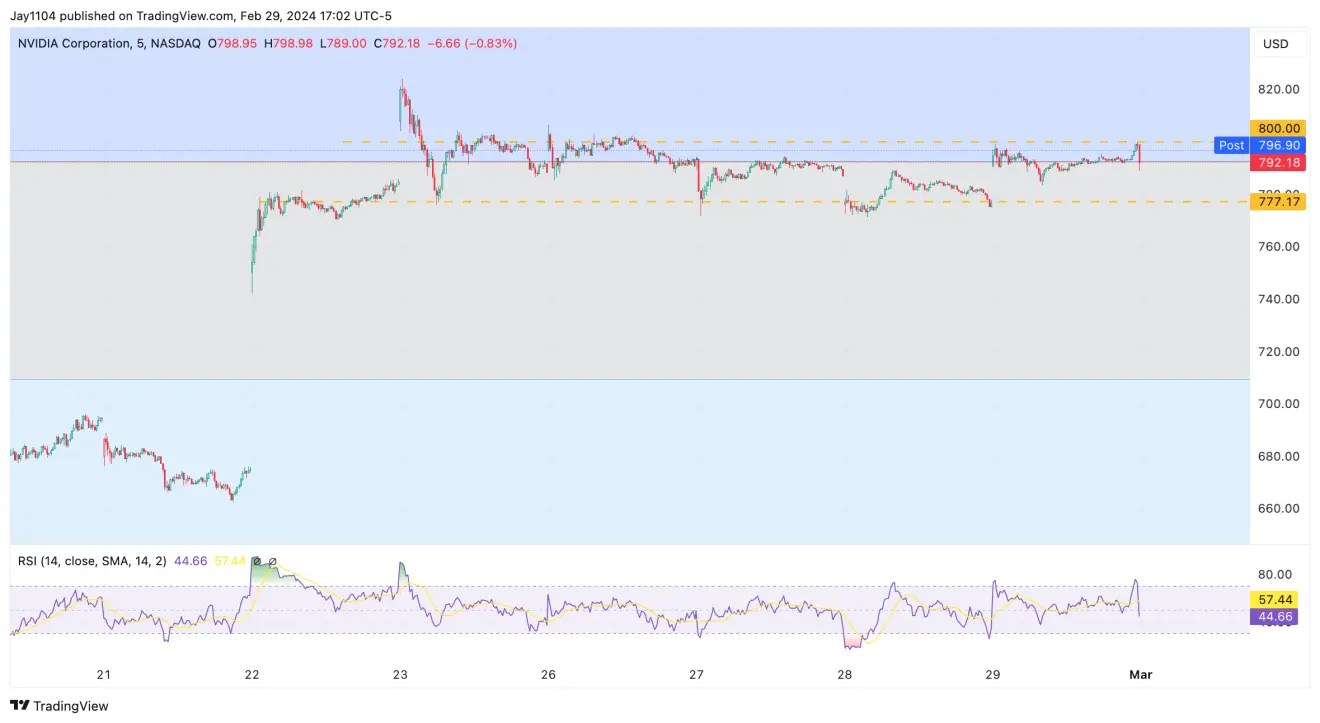 NVDA Corp-5-Minute Chart
In the meantime, the SMH was up 2% on the day, and it is trading at a 100% extension of wave “A,” and it has been unable to surpass the $212 level established last week.
It is not to say that it has to turn lower here, but if you are looking for candidates and you believe in things like Fibanocci extensions and retracements, it seems like as good of a place as any for the rally to terminate.
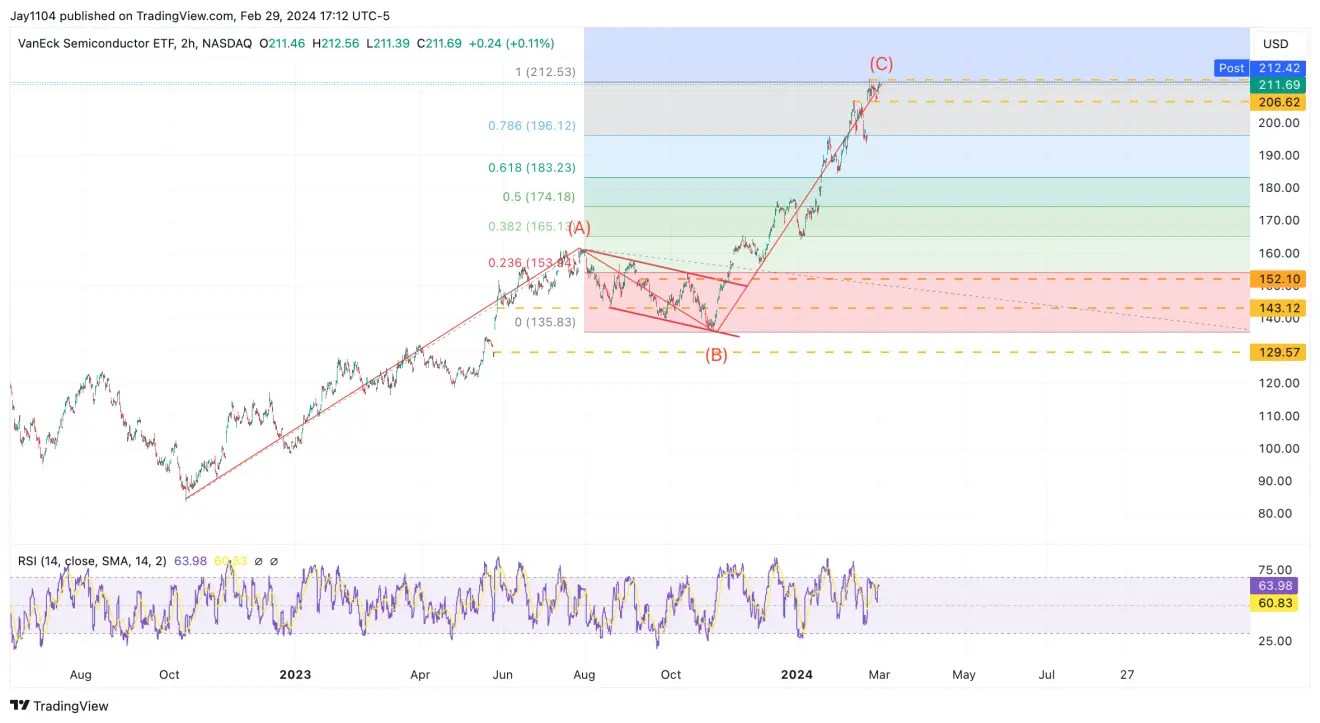 SMH-2-Hour Chart
Anyway, that’s all I have for today. ISM today, and we will see if shipping rates and gasoline show up in the prices paid.
Original Post
Source: Investing.com


