US500
-0.20%
Add to/Remove from Watchlist
Add to Watchlist
Add Position
Position added successfully to:
Please name your holdings portfolio
Type:
BUY
SELL
Date:
Amount:
Price
Point Value:
Leverage:
1:1
1:10
1:25
1:50
1:100
1:200
1:400
1:500
1:1000
Commission:
Create New Watchlist
Create
Create a new holdings portfolio
Add
Create
+ Add another position
Close
Markets are off to an excellent start to October on the back of weaker-than-expected U.S. economic data
Investors believe that a slowdown in industrial activity may help reduce inflationary pressures
However, weaker industrial data, along with a strong dollar, also indicate slower earnings ahead for U.S. companies
The stock market had a strong and sudden rebound in the first two days of October, with the S&P 500 index jumping about 5.75% in the first two sessions of the month. At the time of writing, the benchmark index is giving back some of those gains but is still trading comfortably above its mid-June lows.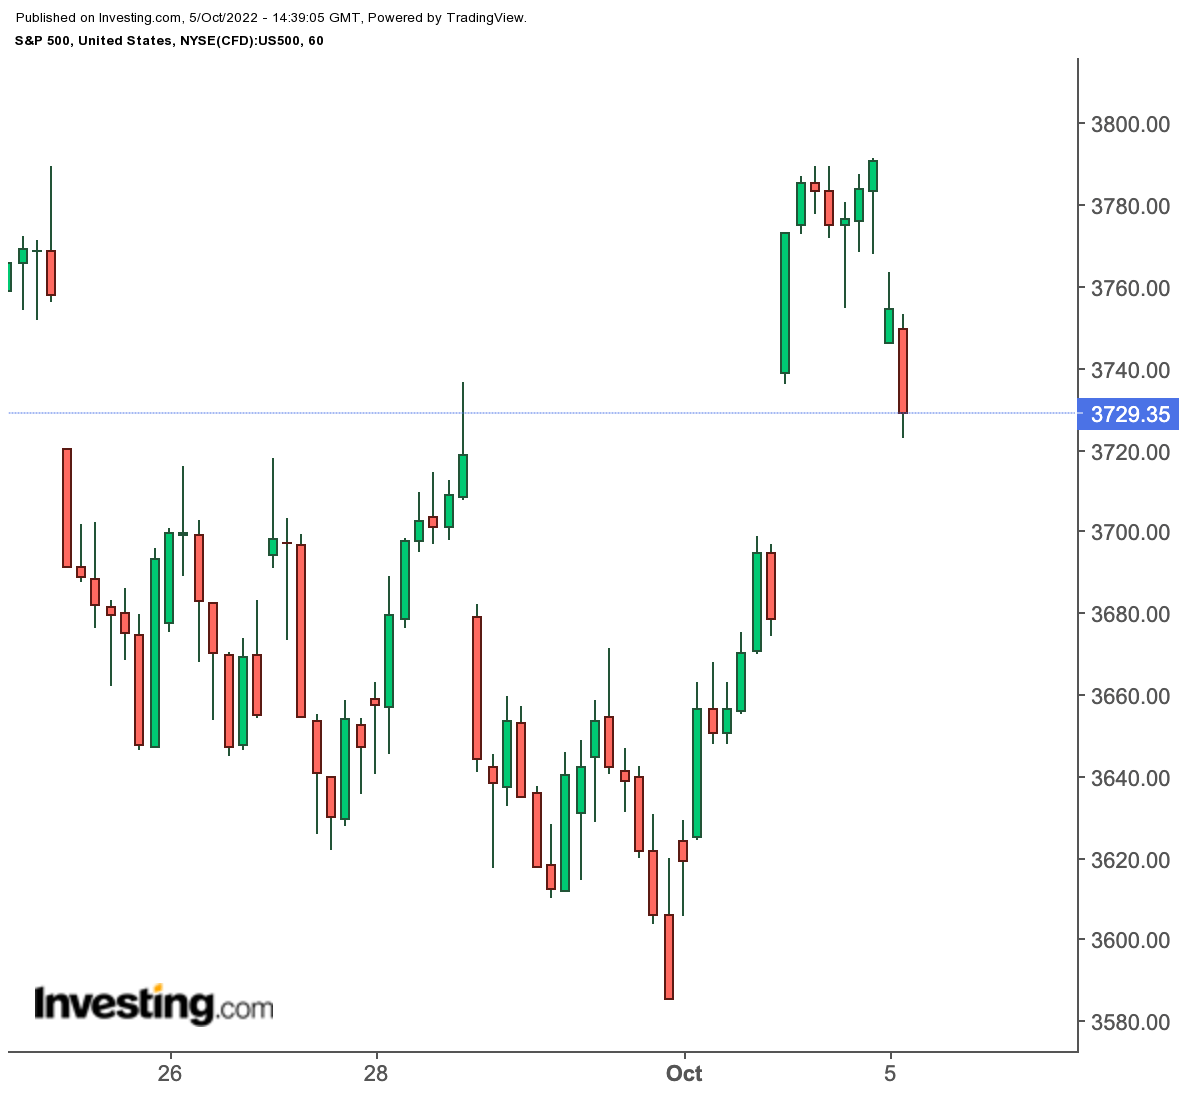 S&P 500 1-Hour ChartBut before we pop the champagne assuming the beginning of a trend reversal, we must analyze the reasons for the rally.
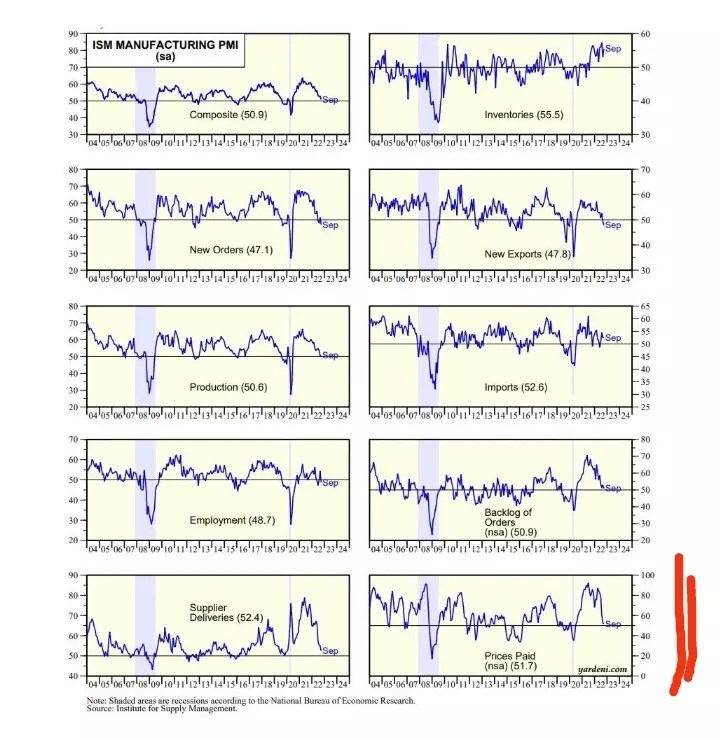 PMI Breakdown
Source: Yardeni.com
One point concerns the charts above. When they say “bad news is good news,” it is as accurate as ever. Yep, the markets practically celebrated a drop in the U.S. manufacturing PMI to the lowest since 2020 (COVID period) and the most significant reduction in U.S. Job openings in nearly 2-1/2 years.
That is particularly important given the current market mindset that if the economy is weaker, inflation must also be subsiding, implying a less-aggressive Fed—and a prolonged market rebound.
Now, Monday also happened to be the first day of the stock market in October, so I found this interesting statistic on the internet: when the market performed above 2% on the first day of the month, how did the markets then do? You see the answer from the next day to six months ahead in the image below.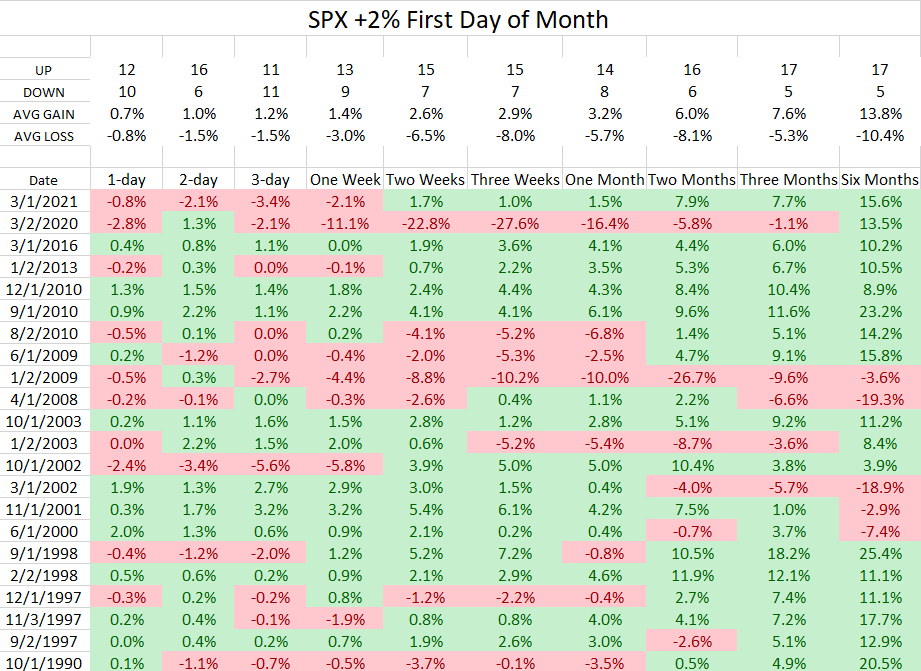 S&P 500 Performance When Gaining 2%+ On The First Day Of The Month
Source: Rennie Yang
Of course, not that we want to cling to this kind of statistic as a certainty. I’ve said a thousand times how I believe one should operate as an investor. Nonetheless, it is at least interesting to see the returns three and six months apart.
Now, after nine months of a bear market and a -21% performance, the real question we must ask ourselves is: what do the markets still have to price in to the downside?
I believe a few things are still missing, the main one being the incoming corporate earnings season. All major U.S. companies will release their quarterly earnings between October and November.
In theory, slower industrial activity combined with a strong dollar (more than half of Big Tech’s revenue comes from outside the U.S.) implies a considerable decline in earnings for just about every sector of the S&P 500.
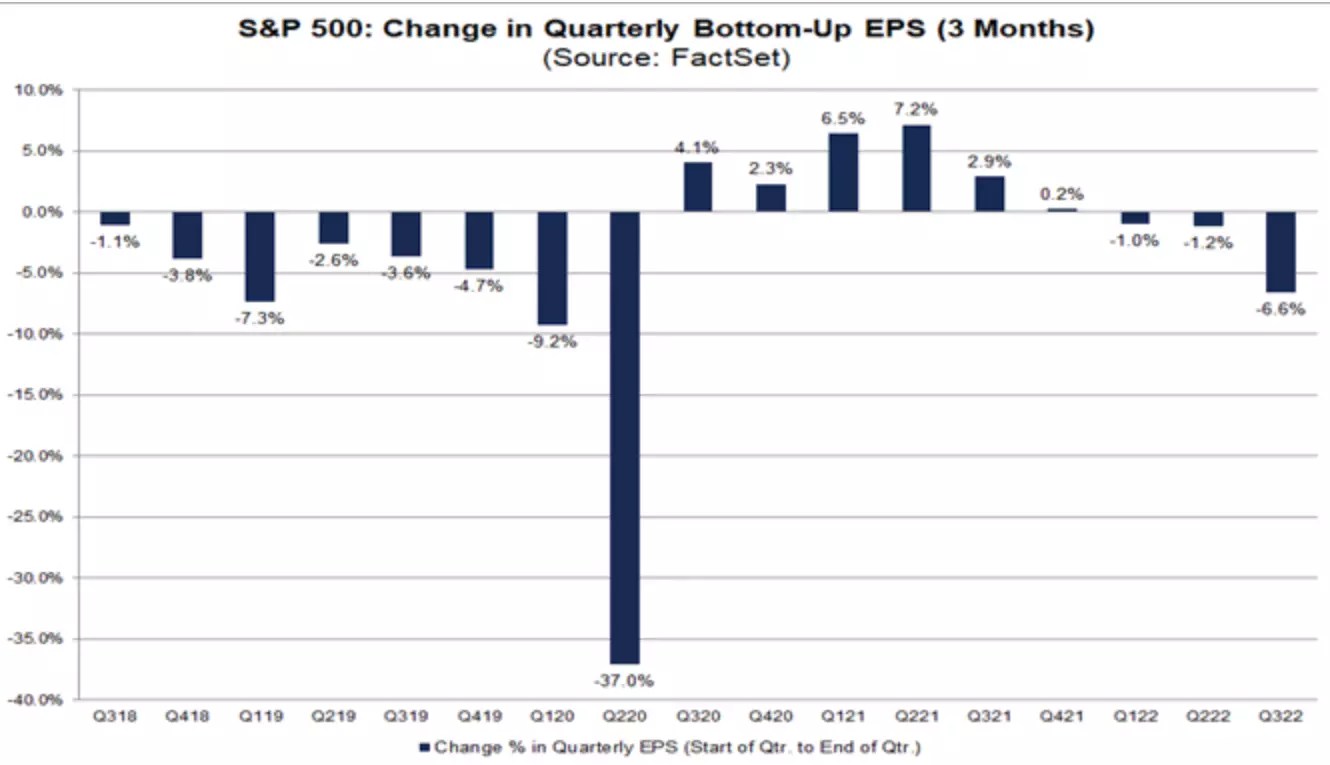 S&P 500 Q3 Bottom-Up EPS Estimate
Source: Factset
This combination of factors may lead to two scenarios:
Conclude the cycle of negative data and news to be discounted, and thus take markets to a new and perhaps definitive bottom. In such a case, my opinion is that investors should take the opportunity to reduce cash holding by progressively buying high-quality assets.
The markets could see weakness in U.S. companies as further evidence supporting the decline in inflation and thus paradoxically perceived, once again, as “good news.” In such a case, all the better for savvy investors that have been preparing for a reversal throughout this year’s bear market.
As I have shown in my most recent analysis, every single bear market in history was followed by an even stronger bull market afterward.
Will this time be different? No one knows, but the odds are certainly on our side.
Disclosure: The author is long on the S&P 500 and will buy more positions should the index continue to drop.
Source: Investing.com


