XAU/USD
-1.23%
Add to/Remove from Watchlist
Add to Watchlist
Add Position
Position added successfully to:
Please name your holdings portfolio
Type:
BUY
SELL
Date:
Amount:
Price
Point Value:
Leverage:
1:1
1:10
1:25
1:50
1:100
1:200
1:400
1:500
1:1000
Commission:
Create New Watchlist
Create
Create a new holdings portfolio
Add
Create
+ Add another position
Close
US500
+2.46%
Add to/Remove from Watchlist
Add to Watchlist
Add Position
Position added successfully to:
Please name your holdings portfolio
Type:
BUY
SELL
Date:
Amount:
Price
Point Value:
Leverage:
1:1
1:10
1:25
1:50
1:100
1:200
1:400
1:500
1:1000
Commission:
Create New Watchlist
Create
Create a new holdings portfolio
Add
Create
+ Add another position
Close
DX
+0.08%
Add to/Remove from Watchlist
Add to Watchlist
Add Position
Position added successfully to:
Please name your holdings portfolio
Type:
BUY
SELL
Date:
Amount:
Price
Point Value:
Leverage:
1:1
1:10
1:25
1:50
1:100
1:200
1:400
1:500
1:1000
Commission:
Create New Watchlist
Create
Create a new holdings portfolio
Add
Create
+ Add another position
Close
Gold
-1.04%
Add to/Remove from Watchlist
Add to Watchlist
Add Position
Position added successfully to:
Please name your holdings portfolio
Type:
BUY
SELL
Date:
Amount:
Price
Point Value:
Leverage:
1:1
1:10
1:25
1:50
1:100
1:200
1:400
1:500
1:1000
Commission:
Create New Watchlist
Create
Create a new holdings portfolio
Add
Create
+ Add another position
Close
BTC/USD
-0.86%
Add to/Remove from Watchlist
Add to Watchlist
Add Position
Position added successfully to:
Please name your holdings portfolio
Type:
BUY
SELL
Date:
Amount:
Price
Point Value:
Leverage:
1:1
1:10
1:25
1:50
1:100
1:200
1:400
1:500
1:1000
Commission:
Create New Watchlist
Create
Create a new holdings portfolio
Add
Create
+ Add another position
Close
Every time the short-term trend rises, traders believe rates will ease
While some central banks began slowing rate hikes, the ECB persisted
US data and Fedspeak suggest the Fed will persist as well
The Federal Open Market Committee’s interest rate decision will test the most extended weekly advance since August. The two-week bounce defied disappointing earnings on the outlook that the Fed will slow its rate hikes. Perhaps traders’ expectations flip on this theme according to the ebb and flow of the market price action.
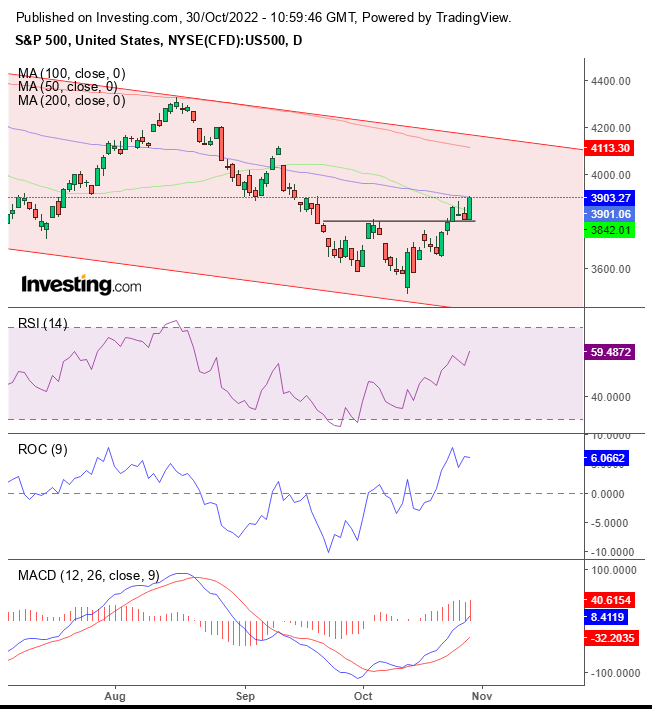
After the S&P 500 Index met a ceiling in mid-August at the top of its falling channel since its January record, investors were concerned that the Fed’s aggressive path to rising interest rates would push the economy into a recession. Before that, when the price rebounded from the mid-June low’s test of the channel, the market narrative dictated that inflation was easing, and so would the Fed’s jumbo hikes.
Now, the momentum is up after the price bottomed out in the short term, within the medium-term downtrend. In last week’s post, I reiterated that stocks could rise in the short term but are on a trajectory to continue lower in the medium term.
The market has bet again and again on a less hawkish Fed, and so far, that has been proven wrong with each end of the short-term uptrends as stocks resynchronized with the medium-term downtrend.
As I showed above, the risk-on risk-off narrative correlated with the short-term swings within the downtrend, the so-called “Fed pivot” drummed up since the summer lows and repeated itself with each bounce. So far, overall data demonstrated persistent inflation, and a hawkish Fed posturing remained steadfast amid ongoing pressure to ease its rate hikes.
Investors also expect central banks around the world to ease tightening. The Reserve Bank of Australia lifted interest rates by a smaller-than-expected 25 basis points on October 4. The Bank of Canada slowed its rate hike by only 0.5%, lower than the 0.75% consensus on October 26.
On the other hand, The European Central Bank maintained the 0.75% rate hike, its fastest rise in history, fuelling recession fears after investors expected a lower 0.5% increase on Thursday. Moreover, ECB President Christine Lagarde pledged to maintain the path to higher rates until reaching the 2% target.
Meanwhile, the yield curve deepened, flashing another recession alarm bell.
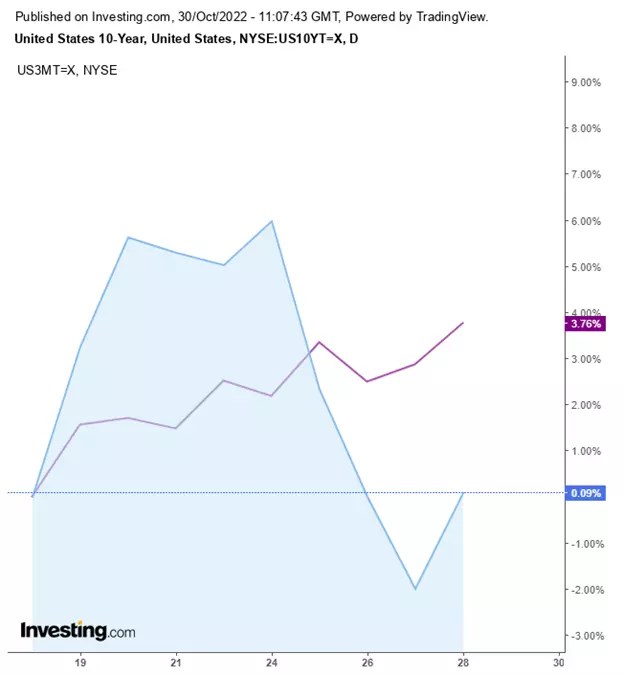 US 10-year vs. 3-Month Chart
On Wednesday, the 10-year note yield fell below the three-month bill. This specific inversion is rare, demonstrating that investors expected the Fed’s persistent and unwavering tightening would push the economy into a recession.
The dollar fell for the second straight week.
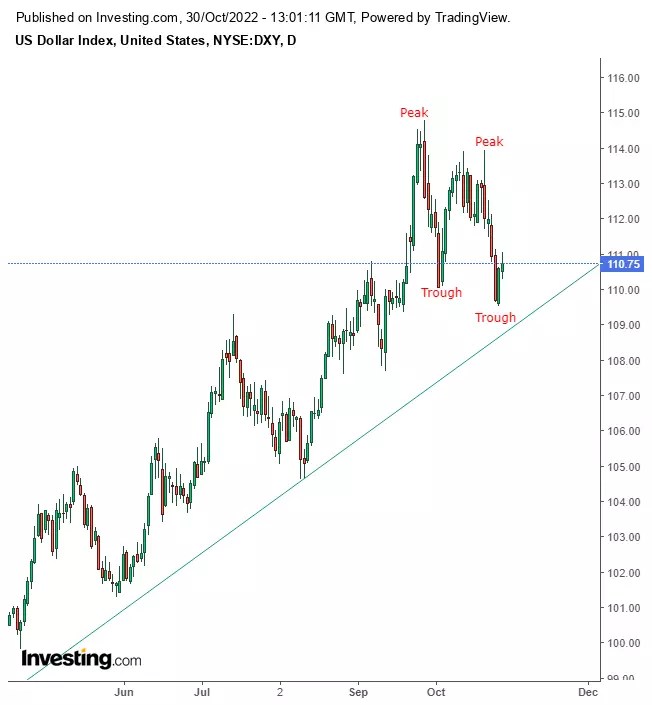 US Dollar chart
The dollar bounced to end the week, extending above the medium-term uptrend, after having registered a descending series in the short term, demonstrating the tension ahead of the US rate decision.
Gold fell despite dollar weakness, as investors preferred to take their money to stocks.
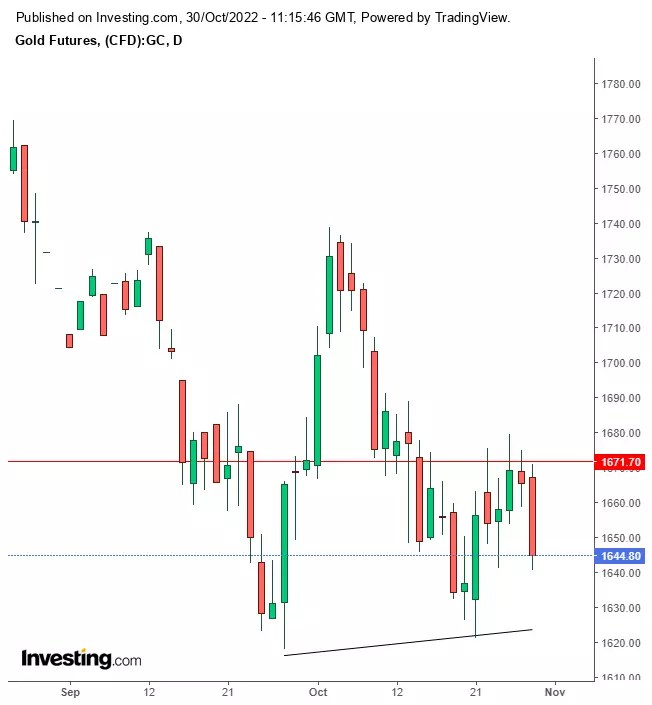 Gold Futures Chart
Gold is developing an H&S continuation pattern, having completed a massive double-top since April 2020.
Bitcoin climbed last week to a six-week high on a short squeeze in a risk-on week.
Technically, however, the trend is still down.
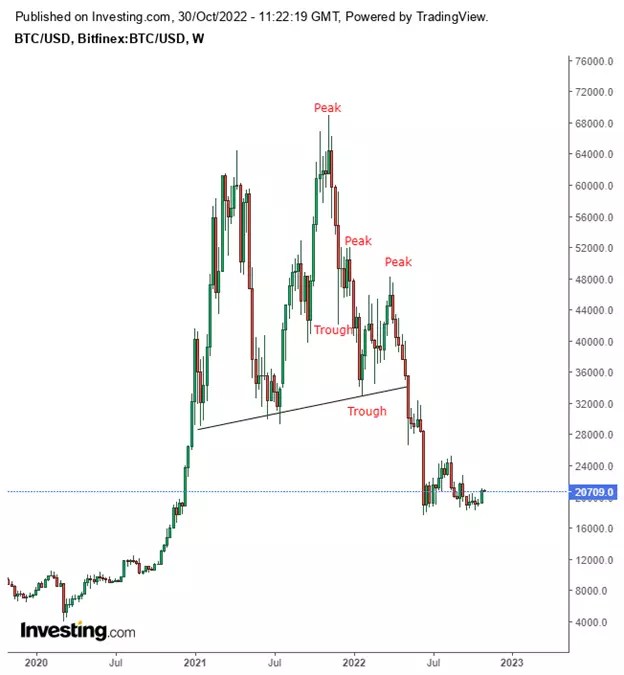 Bitcoin Weekly Chart
The peaks and troughs are descending, and the cryptocurrency completed a massive top, a development I’ve been monitoring since January.
Disclosure: The author has no positions in any instruments mentioned in this article.
Source: Investing.com


