Summary
- The rubber and plastics industry is expected to outperform the S&P broader market substantially this quarter; underperform slightly next quarter, and in 2015; and market-perform beyond.
- Mean/high targets for the three largest U.S. rubber and plastics companies – Goodyear Tire & Rubber (GT), Carlisle Companies (CSL), and Cooper Tire & Rubber (CTB) – range from 7% to 33% above current prices.
- Find out which among Goodyear, Carlisle, and Cooper offers the best stock performance and investment value.
Note: All data are as of the close of Thursday, November 13, 2014. Emphasis is on company fundamentals and financial data rather than commentary.
This is the part where the rubber meets the road, where the traction of a company’s growth is: future sales.
For the rubber and plastics industry, much of its future growth depends on future sales of the auto industry, one of the largest consumers of rubber and plastics. The correlation between auto sales and the stock performance of the three largest U.S. rubber and plastics companies is very stark indeed, as graphed below.
Where total U.S. vehicle sales were averaging about 16.5 million autos annually before the recent economic crisis, auto purchases plunged to the 9 million vehicles per year level by the depth of the recession in early 2009, as graphed below.
The recovery since then has been long, but eventually by mid-2014, total vehicle sales in the U.S. finally returned to the pre-recession level of about 16.5 million units annually.
(click to enlarge)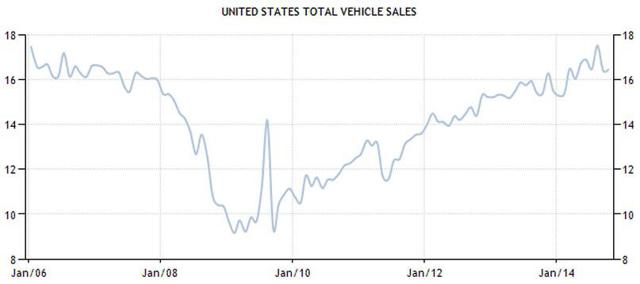
Source: Trading Economics.com.
The stock performances of the three largest U.S. rubber and plastics companies – The Goodyear Tire & Rubber Company (NASDAQ: GT), Carlisle Companies Incorporated (NYSE: CSL), and Cooper Tire & Rubber Co. (NYSE:CTB) – almost perfectly mirror the correction and recovery in auto sales, as graphed below.
From June 2007 until the equity market bottomed in early 2009, where the broader market S&P 500 index [black] lost 55% and the SPDR Consumer Discretionary ETF (NYSE: XLY) [blue] (of which Goodyear is a component) lost 60%, Goodyear [beige] fell 90%, Carlisle [purple] fell 60%, while Cooper [orange] fell 88%.
(click to enlarge)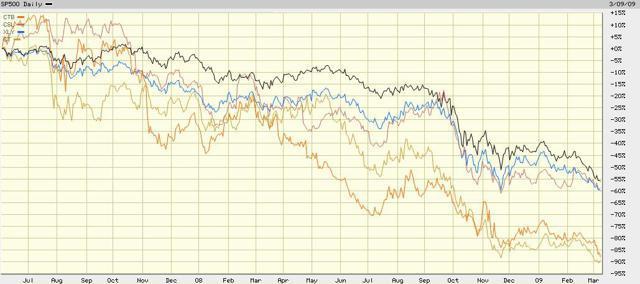
Source: BigCharts.com.
As the economy recovered from March of 2009 to present, all have mounted a stellar come-back, as graphed below. Where the S&P index has gained 200% and the XLY has gained 325%, Goodyear has climbed 550%, Carlisle has grown nearly 400%, while Cooper has soared some 990%.
(click to enlarge)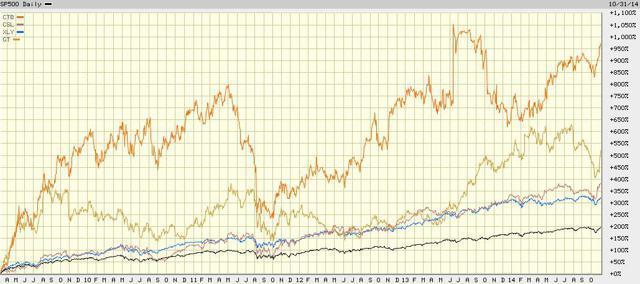
Source: BigCharts.com.
Yet there is more to the rubber and plastics industry than just auto parts and tires, including thermoplastic polyolefin and foam insulation panels used as roofing materials, liquid and spray-applied waterproofing membranes, and HVAC duct sealants and hardware – all used in the commercial and residential construction markets. Naturally, the boom in home construction throughout the economic recovery has also helped boost the Rubber & Plastics industry’s bounce.
With total U.S. vehicle sales expected to remain steady at an annualized average (in millions) of 17.3, 17.37, 17.24 and 17.14 over the next four quarters, and with housing starts also expected to hold steady at an annualized average (in millions) of 1.050, 1,047, 1.044 and 1.053 over the next four quarters as forecast by TradingEconomics, the rubber and plastics industry is seen growing at more-or-less par with the broader market, as tabled below where green indicates outperformance while yellow denotes underperformance.
While the current quarter is still expected to contain a sizable growth spurt for the industry at more than 2.1 times the average growth rate of the broader market, the industry’s earnings are seen slowing to very close to the market’s average in 2015 and beyond.
(click to enlarge)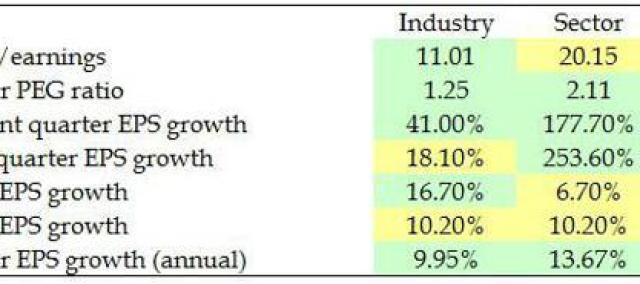
Zooming in a little closer, the three largest U.S. companies in the industry are expected to put in a split performance, with Goodyear underperforming near term and in 2015 before outperforming over the next five years, Carlisle having a better 2015 and beyond than Goodyear, and Cooper performing in reverse with strong growth near term slowing to underperformance over the longer term.
(click to enlarge)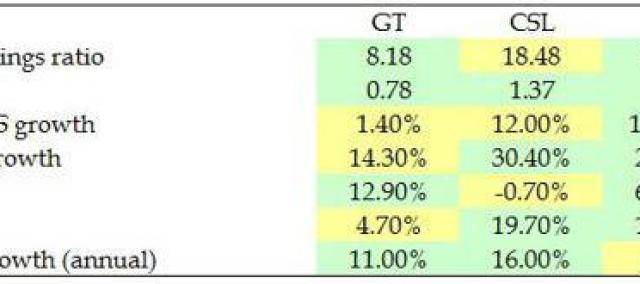
Yet there is more than earnings growth to consider when sizing up a company as a potential investment. How do the three compare against one another in other metrics, and which makes the best investment?
Let’s answer that by comparing their company fundamentals using the following format: a) financial comparisons, b) estimates and analyst recommendations, and c) rankings with accompanying data table. As we compare each metric, the best performing company will be shaded green while the worst performing will be shaded yellow, which will later be tallied for the final ranking.
A) Financial Comparisons
• Market Capitalization: While company size does not necessarily imply an advantage and is thus not ranked, it is important as a denominator against which other financial data will be compared for ranking.
(click to enlarge)
• Growth: Since revenues and expenses can vary greatly from one season to another, growth is measured on a year-over-year quarterly basis, where Q1 of this year is compared to Q1 of the previous year, for example.
In the most recently reported quarter, Carlisle posted the greatest revenue growth year-over-year by a significant degree, while Goodyear posted revenue shrinkage.
Since Cooper’s earnings growth is not available, the metric will not factor into the comparison. Though it is worthy to note that Carlisle’s earnings beat Goodyear’s, which again recorded shrinkage.
(click to enlarge)
• Profitability: A company’s margins are important in determining how much profit the company generates from its sales. Operating margin indicates the percentage earned after operating costs, such as labor, materials, and overhead. Profit margin indicates the profit left over after operating costs plus all other costs, including debt, interest, taxes and depreciation.
Of our three contestants, Carlisle operated with the widest profit and operating margins, while Goodyear contended with the narrowest.
(click to enlarge)
• Management Effectiveness: Shareholders are keenly interested in management’s ability to do more with what has been given to it. Management’s effectiveness is measured by the returns generated from the assets under its control, and from the equity invested into the company by shareholders.
For their managerial performance, where Carlisle’s management team delivered the greatest returns on assets and Goodyear’s team delivered the greatest returns on equity, the two companies reciprocated the poorest returns.
(click to enlarge)
• Earnings Per Share: Of all the metrics measuring a company’s income, earnings per share is probably the most meaningful to shareholders, as this represents the value that the company is adding to each share outstanding. Since the number of shares outstanding varies from company to company, I prefer to convert EPS into a percentage of the current stock price to better determine where an investment could gain the most value.
Of the three companies here compared, Goodyear provides common stock holders with the greatest diluted earnings per share gain as a percentage of its current share price, while Carlisle’s DEPS over stock price is the lowest.
(click to enlarge)
• Share Price Value: Even if a company outperforms its peers on all the above metrics, however, investors may still shy away from its stock if its price is already trading too high. This is where the stock price relative to forward earnings and company book value come under scrutiny, as well as the stock price relative to earnings relative to earnings growth, known as the PEG ratio. Lower ratios indicate the stock price is currently trading at a cheaper price than its peers, and might thus be a bargain.
Among our three combatants, Goodyear’s stock is cheapest relative to forward earnings and 5-year PEG, where Cooper’s stock represents the best value relative to company book. At the overpriced end of the spectrum, where Carlisle’s stock is the most overpriced relative to forward earnings and PEG, Goodyear’s is the most overvalued relative to book.
(click to enlarge)
B) Estimates and Analyst Recommendations
Of course, no matter how skilled we perceive ourselves to be at gauging a stock’s prospects as an investment, we’d be wise to at least consider what professional analysts and the companies themselves are projecting – including estimated future earnings per share and the growth rate of those earnings, stock price targets, and buy/sell recommendations.
• Earnings Estimates: To properly compare estimated future earnings per share across multiple companies, we would need to convert them into a percentage of their stocks’ current prices.
Of our three specimens, Goodyear offers the highest percentage of the current quarter’s earnings and 2015’s earnings over its current stock price, Cooper offers the highest percentage of next quarter’s earnings, while Carlisle offers the lowest percentages for all time periods.
(click to enlarge)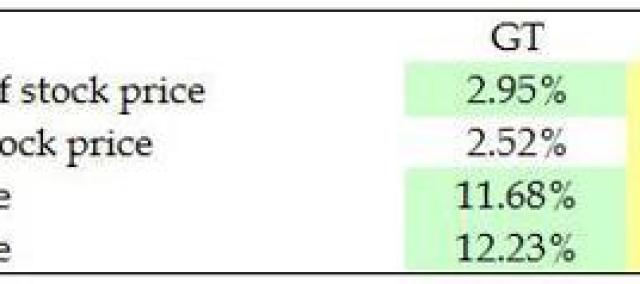
• Earnings Growth: For long-term investors this metric is one of the most important to consider, as it denotes the percentage by which earnings are expected to grow or shrink as compared to earnings from corresponding periods a year prior.
For earnings growth, both Carlisle and Cooper are projected to deliver the greatest growth over the near term, while Carlisle is seen delivering the best in 2015 and beyond. At the low growth end of the scale, Goodyear is believed to offer the slowest growth over the near term while Cooper offers it over the next five years.
(click to enlarge)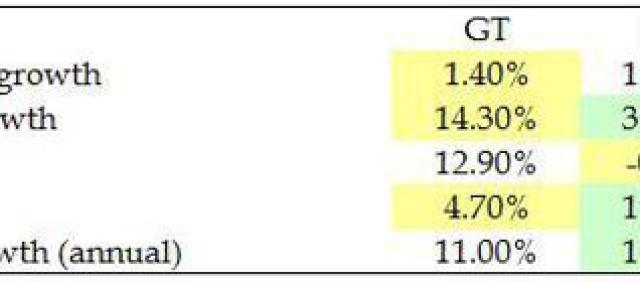
• Price Targets: Like earnings estimates above, a company’s stock price targets must also be converted into a percentage of its current price to properly compare multiple companies.
For their high, mean and low price targets over the coming 12 months, analysts believe Goodyear’s stock has the greatest upside potential and greatest downside risk, while Carlisle’s stock has the least upside and Cooper’s has the least downside.
It must be noted, however, that Cooper’s stock is already trading below its low target. While this may mean an increased potential for a sharp move upward, it may warrant a reassessment of future expectations.
(click to enlarge)
• Buy/Sell Recommendations: After all is said and done, perhaps the one gauge that sums it all up are analyst recommendations. These have been converted into the percentage of analysts recommending each level. However, I factor only the strong buy and buy recommendations into the ranking. Hold, underperform and sell recommendations are not ranked since they are determined after determining the winners of the strong buy and buy categories, and would only be negating those winners of their duly earned titles.
Of our three contenders, Carlisle is best recommended with 3 strong buy and 3 buy representing a combined 85.72% of its 7 analyst, followed by Liberty with 4 strong buy and 3 buy recommendations representing 63.63% of its 11 analysts, and lastly by Cooper with 1 strong buy and 2 buy ratings representing 50% of its 6 analysts.
(click to enlarge)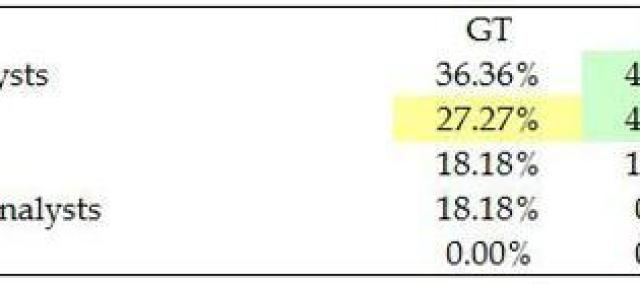
C) Rankings
Having crunched all the numbers and compared all the projections, the time has come to tally up the wins and losses and rank our three competitors against one another.
In the table below you will find all of the data considered above plus a few others not reviewed. Here is where using a company’s market cap as a denominator comes into play, as much of the data in the table has been converted into a percentage of market cap for a fair comparison.
The first and last placed companies are shaded. We then add together each company’s finishes to determine its overall ranking, with first place finishes counting as merits while last place finishes count as demerits.
(click to enlarge)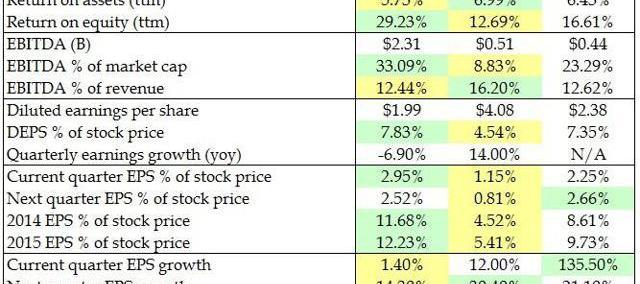
And the winner is… Cooper rolling right along, outperforming in 7 metrics and underperforming in 2 for a net score of +5, followed by a deflated Carlisle, outperforming in 12 metrics and underperforming in 14 for a net score of -2, and a punctured Goodyear having a bad year, outperforming in 11 metrics and underperforming in 14 for a net score of -3.
Where the rubber and plastics industry is expected to outperform the S&P broader market substantially this quarter, underperform slightly next quarter and in 2015, and market-perform beyond, the three largest U.S. companies in the space are expected to split perform – with Goodyear’s earnings shrinking over the immediate term then beating the market’s average over the longer term, Carlisle doing much of the same with a stronger 2015 and beyond, while Cooper’s earnings grow exceptionally well near term before tapering off to underperform the market over the next five years.
Yet after taking all company fundamentals into account, Cooper Tire & Rubber Company simply peels rubber ahead of its peers, given its lowest stock price to book value, highest next quarter earnings over current stock price, highest current quarter earnings growth, highest dividend, best mean and low price targets, and for taking the fewest demerits in having the fewest last place rankings – handily winning the rubber and plastics industry competition.


