MZN
-0.46%
Add to/Remove from Watchlist
Add to Watchlist
Add Position
Position added successfully to:
Please name your holdings portfolio
Type:
BUY
SELL
Date:
Amount:
Price
Point Value:
Leverage:
1:1
1:10
1:25
1:50
1:100
1:200
1:400
1:500
1:1000
Commission:
Create New Watchlist
Create
Create a new holdings portfolio
Add
Create
+ Add another position
Close
ZL
+2.03%
Add to/Remove from Watchlist
Add to Watchlist
Add Position
Position added successfully to:
Please name your holdings portfolio
Type:
BUY
SELL
Date:
Amount:
Price
Point Value:
Leverage:
1:1
1:10
1:25
1:50
1:100
1:200
1:400
1:500
1:1000
Commission:
Create New Watchlist
Create
Create a new holdings portfolio
Add
Create
+ Add another position
Close
ZS
+0.99%
Add to/Remove from Watchlist
Add to Watchlist
Add Position
Position added successfully to:
Please name your holdings portfolio
Type:
BUY
SELL
Date:
Amount:
Price
Point Value:
Leverage:
1:1
1:10
1:25
1:50
1:100
1:200
1:400
1:500
1:1000
Commission:
Create New Watchlist
Create
Create a new holdings portfolio
Add
Create
+ Add another position
Close
ZW
+3.78%
Add to/Remove from Watchlist
Add to Watchlist
Add Position
Position added successfully to:
Please name your holdings portfolio
Type:
BUY
SELL
Date:
Amount:
Price
Point Value:
Leverage:
1:1
1:10
1:25
1:50
1:100
1:200
1:400
1:500
1:1000
Commission:
Create New Watchlist
Create
Create a new holdings portfolio
Add
Create
+ Add another position
Close
US Corn
+1.51%
Add to/Remove from Watchlist
Add to Watchlist
Add Position
Position added successfully to:
Please name your holdings portfolio
Type:
BUY
SELL
Date:
Amount:
Price
Point Value:
Leverage:
1:1
1:10
1:25
1:50
1:100
1:200
1:400
1:500
1:1000
Commission:
Create New Watchlist
Create
Create a new holdings portfolio
Add
Create
+ Add another position
Close
ZM
+0.68%
Add to/Remove from Watchlist
Add to Watchlist
Add Position
Position added successfully to:
Please name your holdings portfolio
Type:
BUY
SELL
Date:
Amount:
Price
Point Value:
Leverage:
1:1
1:10
1:25
1:50
1:100
1:200
1:400
1:500
1:1000
Commission:
Create New Watchlist
Create
Create a new holdings portfolio
Add
Create
+ Add another position
Close
NYF
-0.37%
Add to/Remove from Watchlist
Add to Watchlist
Add Position
Position added successfully to:
Please name your holdings portfolio
Type:
BUY
SELL
Date:
Amount:
Price
Point Value:
Leverage:
1:1
1:10
1:25
1:50
1:100
1:200
1:400
1:500
1:1000
Commission:
Create New Watchlist
Create
Create a new holdings portfolio
Add
Create
+ Add another position
Close
RR
-0.92%
Add to/Remove from Watchlist
Add to Watchlist
Add Position
Position added successfully to:
Please name your holdings portfolio
Type:
BUY
SELL
Date:
Amount:
Price
Point Value:
Leverage:
1:1
1:10
1:25
1:50
1:100
1:200
1:400
1:500
1:1000
Commission:
Create New Watchlist
Create
Create a new holdings portfolio
Add
Create
+ Add another position
Close
MAL
-0.22%
Add to/Remove from Watchlist
Add to Watchlist
Add Position
Position added successfully to:
Please name your holdings portfolio
Type:
BUY
SELL
Date:
Amount:
Price
Point Value:
Leverage:
1:1
1:10
1:25
1:50
1:100
1:200
1:400
1:500
1:1000
Commission:
Create New Watchlist
Create
Create a new holdings portfolio
Add
Create
+ Add another position
Close
LCc1
+0.18%
Add to/Remove from Watchlist
Add to Watchlist
Add Position
Position added successfully to:
Please name your holdings portfolio
Type:
BUY
SELL
Date:
Amount:
Price
Point Value:
Leverage:
1:1
1:10
1:25
1:50
1:100
1:200
1:400
1:500
1:1000
Commission:
Create New Watchlist
Create
Create a new holdings portfolio
Add
Create
+ Add another position
Close
Lumber
+1.04%
Add to/Remove from Watchlist
Add to Watchlist
Add Position
Position added successfully to:
Please name your holdings portfolio
Type:
BUY
SELL
Date:
Amount:
Price
Point Value:
Leverage:
1:1
1:10
1:25
1:50
1:100
1:200
1:400
1:500
1:1000
Commission:
Create New Watchlist
Create
Create a new holdings portfolio
Add
Create
+ Add another position
Close
NICKEL
+0.48%
Add to/Remove from Watchlist
Add to Watchlist
Add Position
Position added successfully to:
Please name your holdings portfolio
Type:
BUY
SELL
Date:
Amount:
Price
Point Value:
Leverage:
1:1
1:10
1:25
1:50
1:100
1:200
1:400
1:500
1:1000
Commission:
Create New Watchlist
Create
Create a new holdings portfolio
Add
Create
+ Add another position
Close
MCU
+0.30%
Add to/Remove from Watchlist
Add to Watchlist
Add Position
Position added successfully to:
Please name your holdings portfolio
Type:
BUY
SELL
Date:
Amount:
Price
Point Value:
Leverage:
1:1
1:10
1:25
1:50
1:100
1:200
1:400
1:500
1:1000
Commission:
Create New Watchlist
Create
Create a new holdings portfolio
Add
Create
+ Add another position
Close
FC
-1.31%
Add to/Remove from Watchlist
Add to Watchlist
Add Position
Position added successfully to:
Please name your holdings portfolio
Type:
BUY
SELL
Date:
Amount:
Price
Point Value:
Leverage:
1:1
1:10
1:25
1:50
1:100
1:200
1:400
1:500
1:1000
Commission:
Create New Watchlist
Create
Create a new holdings portfolio
Add
Create
+ Add another position
Close
Oats c1
+4.27%
Add to/Remove from Watchlist
Add to Watchlist
Add Position
Position added successfully to:
Please name your holdings portfolio
Type:
BUY
SELL
Date:
Amount:
Price
Point Value:
Leverage:
1:1
1:10
1:25
1:50
1:100
1:200
1:400
1:500
1:1000
Commission:
Create New Watchlist
Create
Create a new holdings portfolio
Add
Create
+ Add another position
Close
LGOc1
+0.58%
Add to/Remove from Watchlist
Add to Watchlist
Add Position
Position added successfully to:
Please name your holdings portfolio
Type:
BUY
SELL
Date:
Amount:
Price
Point Value:
Leverage:
1:1
1:10
1:25
1:50
1:100
1:200
1:400
1:500
1:1000
Commission:
Create New Watchlist
Create
Create a new holdings portfolio
Add
Create
+ Add another position
Close
LRCc1
+0.47%
Add to/Remove from Watchlist
Add to Watchlist
Add Position
Position added successfully to:
Please name your holdings portfolio
Type:
BUY
SELL
Date:
Amount:
Price
Point Value:
Leverage:
1:1
1:10
1:25
1:50
1:100
1:200
1:400
1:500
1:1000
Commission:
Create New Watchlist
Create
Create a new holdings portfolio
Add
Create
+ Add another position
Close
LRBc1
-0.24%
Add to/Remove from Watchlist
Add to Watchlist
Add Position
Position added successfully to:
Please name your holdings portfolio
Type:
BUY
SELL
Date:
Amount:
Price
Point Value:
Leverage:
1:1
1:10
1:25
1:50
1:100
1:200
1:400
1:500
1:1000
Commission:
Create New Watchlist
Create
Create a new holdings portfolio
Add
Create
+ Add another position
Close
CT
+0.34%
Add to/Remove from Watchlist
Add to Watchlist
Add Position
Position added successfully to:
Please name your holdings portfolio
Type:
BUY
SELL
Date:
Amount:
Price
Point Value:
Leverage:
1:1
1:10
1:25
1:50
1:100
1:200
1:400
1:500
1:1000
Commission:
Create New Watchlist
Create
Create a new holdings portfolio
Add
Create
+ Add another position
Close
XAG/USD
+2.26%
Add to/Remove from Watchlist
Add to Watchlist
Add Position
Position added successfully to:
Please name your holdings portfolio
Type:
BUY
SELL
Date:
Amount:
Price
Point Value:
Leverage:
1:1
1:10
1:25
1:50
1:100
1:200
1:400
1:500
1:1000
Commission:
Create New Watchlist
Create
Create a new holdings portfolio
Add
Create
+ Add another position
Close
DX
-0.54%
Add to/Remove from Watchlist
Add to Watchlist
Add Position
Position added successfully to:
Please name your holdings portfolio
Type:
BUY
SELL
Date:
Amount:
Price
Point Value:
Leverage:
1:1
1:10
1:25
1:50
1:100
1:200
1:400
1:500
1:1000
Commission:
Create New Watchlist
Create
Create a new holdings portfolio
Add
Create
+ Add another position
Close
Gold
+0.75%
Add to/Remove from Watchlist
Add to Watchlist
Add Position
Position added successfully to:
Please name your holdings portfolio
Type:
BUY
SELL
Date:
Amount:
Price
Point Value:
Leverage:
1:1
1:10
1:25
1:50
1:100
1:200
1:400
1:500
1:1000
Commission:
Create New Watchlist
Create
Create a new holdings portfolio
Add
Create
+ Add another position
Close
Copper
+0.59%
Add to/Remove from Watchlist
Add to Watchlist
Add Position
Position added successfully to:
Please name your holdings portfolio
Type:
BUY
SELL
Date:
Amount:
Price
Point Value:
Leverage:
1:1
1:10
1:25
1:50
1:100
1:200
1:400
1:500
1:1000
Commission:
Create New Watchlist
Create
Create a new holdings portfolio
Add
Create
+ Add another position
Close
KC
-0.80%
Add to/Remove from Watchlist
Add to Watchlist
Add Position
Position added successfully to:
Please name your holdings portfolio
Type:
BUY
SELL
Date:
Amount:
Price
Point Value:
Leverage:
1:1
1:10
1:25
1:50
1:100
1:200
1:400
1:500
1:1000
Commission:
Create New Watchlist
Create
Create a new holdings portfolio
Add
Create
+ Add another position
Close
LCO
+0.78%
Add to/Remove from Watchlist
Add to Watchlist
Add Position
Position added successfully to:
Please name your holdings portfolio
Type:
BUY
SELL
Date:
Amount:
Price
Point Value:
Leverage:
1:1
1:10
1:25
1:50
1:100
1:200
1:400
1:500
1:1000
Commission:
Create New Watchlist
Create
Create a new holdings portfolio
Add
Create
+ Add another position
Close
Silver
+2.49%
Add to/Remove from Watchlist
Add to Watchlist
Add Position
Position added successfully to:
Please name your holdings portfolio
Type:
BUY
SELL
Date:
Amount:
Price
Point Value:
Leverage:
1:1
1:10
1:25
1:50
1:100
1:200
1:400
1:500
1:1000
Commission:
Create New Watchlist
Create
Create a new holdings portfolio
Add
Create
+ Add another position
Close
CL
+0.75%
Add to/Remove from Watchlist
Add to Watchlist
Add Position
Position added successfully to:
Please name your holdings portfolio
Type:
BUY
SELL
Date:
Amount:
Price
Point Value:
Leverage:
1:1
1:10
1:25
1:50
1:100
1:200
1:400
1:500
1:1000
Commission:
Create New Watchlist
Create
Create a new holdings portfolio
Add
Create
+ Add another position
Close
XAU/USD
+0.68%
Add to/Remove from Watchlist
Add to Watchlist
Add Position
Position added successfully to:
Please name your holdings portfolio
Type:
BUY
SELL
Date:
Amount:
Price
Point Value:
Leverage:
1:1
1:10
1:25
1:50
1:100
1:200
1:400
1:500
1:1000
Commission:
Create New Watchlist
Create
Create a new holdings portfolio
Add
Create
+ Add another position
Close
NG
+1.70%
Add to/Remove from Watchlist
Add to Watchlist
Add Position
Position added successfully to:
Please name your holdings portfolio
Type:
BUY
SELL
Date:
Amount:
Price
Point Value:
Leverage:
1:1
1:10
1:25
1:50
1:100
1:200
1:400
1:500
1:1000
Commission:
Create New Watchlist
Create
Create a new holdings portfolio
Add
Create
+ Add another position
Close
SB
+0.10%
Add to/Remove from Watchlist
Add to Watchlist
Add Position
Position added successfully to:
Please name your holdings portfolio
Type:
BUY
SELL
Date:
Amount:
Price
Point Value:
Leverage:
1:1
1:10
1:25
1:50
1:100
1:200
1:400
1:500
1:1000
Commission:
Create New Watchlist
Create
Create a new holdings portfolio
Add
Create
+ Add another position
Close
PA
+0.58%
Add to/Remove from Watchlist
Add to Watchlist
Add Position
Position added successfully to:
Please name your holdings portfolio
Type:
BUY
SELL
Date:
Amount:
Price
Point Value:
Leverage:
1:1
1:10
1:25
1:50
1:100
1:200
1:400
1:500
1:1000
Commission:
Create New Watchlist
Create
Create a new holdings portfolio
Add
Create
+ Add another position
Close
OJ
-0.01%
Add to/Remove from Watchlist
Add to Watchlist
Add Position
Position added successfully to:
Please name your holdings portfolio
Type:
BUY
SELL
Date:
Amount:
Price
Point Value:
Leverage:
1:1
1:10
1:25
1:50
1:100
1:200
1:400
1:500
1:1000
Commission:
Create New Watchlist
Create
Create a new holdings portfolio
Add
Create
+ Add another position
Close
CC
+0.10%
Add to/Remove from Watchlist
Add to Watchlist
Add Position
Position added successfully to:
Please name your holdings portfolio
Type:
BUY
SELL
Date:
Amount:
Price
Point Value:
Leverage:
1:1
1:10
1:25
1:50
1:100
1:200
1:400
1:500
1:1000
Commission:
Create New Watchlist
Create
Create a new holdings portfolio
Add
Create
+ Add another position
Close
PL
+2.51%
Add to/Remove from Watchlist
Add to Watchlist
Add Position
Position added successfully to:
Please name your holdings portfolio
Type:
BUY
SELL
Date:
Amount:
Price
Point Value:
Leverage:
1:1
1:10
1:25
1:50
1:100
1:200
1:400
1:500
1:1000
Commission:
Create New Watchlist
Create
Create a new holdings portfolio
Add
Create
+ Add another position
Close
LHc1
+0.88%
Add to/Remove from Watchlist
Add to Watchlist
Add Position
Position added successfully to:
Please name your holdings portfolio
Type:
BUY
SELL
Date:
Amount:
Price
Point Value:
Leverage:
1:1
1:10
1:25
1:50
1:100
1:200
1:400
1:500
1:1000
Commission:
Create New Watchlist
Create
Create a new holdings portfolio
Add
Create
+ Add another position
Close
17 of 34 commodities tracked by Investing.com show annual losses
Slide comes as dollar rallies anew on notion Fed may turn hawkish again in 2023
How much lower could the losing commodities go before the year-end?
How much higher could the winners climb?
With just three weeks to the end of 2022, half of the world’s prominent commodities are showing annual losses as the U.S. dollar, the currency that determines their prices, rallies anew on the notion that the Federal Reserve could be aggressive again with rate hikes in the coming year.
Strong U.S. factory-made goods to non-manufacturing data in recent days have incentivized dollar bulls to establish new long positions in the currency against rivals like the euro and yen, putting fresh pressure on prices of raw materials that have increasingly turned from positive to negative over the past few months.
At the time of writing, the Dollar Index was up 10.4% on the year at 105.545. The index peaked at a 2022 high of 114.745 in September, giving it a gain of as much as 20% at that time.
Seventeen, or half, of the 34 major commodity markets tracked by Investing.com were in the red for the year.
Those with annual losses were:
U.S. West Texas Intermediate, or WTI, crude oil (-0.9%)
Gold futures (-2.4%)
Spot gold (-3.0%)
Silver futures (3.8%)
Spot silver (-4.07%)
Aluminium (-10.92%)
Zinc futures (-11.4%)
Palladium futures (-1.56%)
U.S.-traded copper futures (-12.77%)
U.K.-traded copper (-13.65%)
Wheat futures (-5.48%)
Cotton futures (-25.59)
Cocoa futures (-2.51%)
U.S.-traded coffee futures (-27.44%)
U.K.-traded robusta coffee (-19.03%)
Lumber futures (-63.84%)
Oats futures (-50.07%).
Those in the green were:
U.K.-traded Brent oil (2.47%)
Natural gas (50.08%)
Heating oil (25.26%)
Gasoline futures (8.09%)
U.K.-traded gasoil (24.21%)
Platinum Futures (3.41%)
Nickel Futures (39.79%)
Rough Rice (15.09%)
Corn Futures (7.39%)
Soybean Futures (10.02%)
Soybean oil(9.78%)
Soybean meal futures (9.23%)
Sugar futures (2.65%)
Live cattle (9.11%)
Feeder cattle futures (8.76%)
Lean hogs (1.02%)
Orange juice (42.39%).
As we prepare for 2023, a few questions remain:
Technically, how much lower could the losing commodities go before the year-end? What’s the likely bottom on the charts?
On the other end, how much higher could the winners climb? What’s their potential resistance?
SKCharting.com, our regular collaborator on commodities charting, will attempt to help us answer these, beginning with the Dollar Index, which is expected to be the main variable for the moves across commodities over the next three weeks.
Dollar Index: Potential High and Bottom
After losing half its value over just two months, the Dollar Index has started rebounding since the end of last week on the strength of U.S. macroeconomic data that spawned the notion of a more hawkish-than-thought Fed in 2023.
For context, the Fed has added 375 basis points to U.S. rates since March, with four jumbo-sized 75-bp hikes between June and November. Up until last week, the expectation was for the central bank to impose a smaller increase of 50 bp at its upcoming Dec. 14 rate decision and continue tapering hikes in the new year. As of early Wednesday, the 50-bps hike was still on the cards, though traders weren’t sure how much the Fed would increase in February — the first rate adjustment due in 2023.
The Dollar Index’s chart shows a recovery from Monday’s session low of 104.065 to reach 105.765 by early Wednesday.
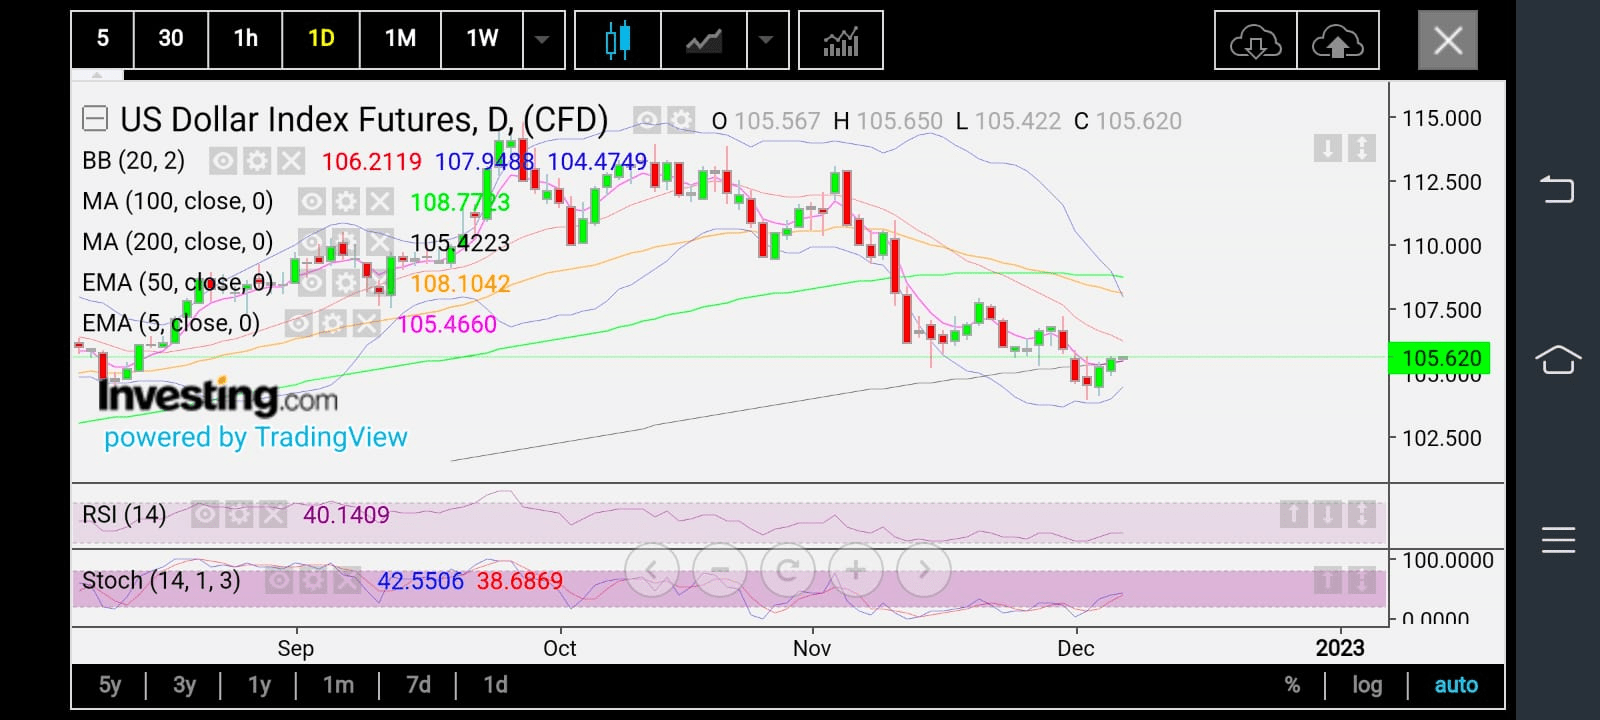 U.S. Dollar Index Daily Chart
SKCharting’s observations show that the index’s 50-week Exponential Moving Average, or EMA, of 104.50 and oversold weekly stochastics warrant a bounce back.
“The rebound can extend further to the 5-week EMA of 106.30 if the 105 level holds strong,” it said.
Commodity Losers: Potential Bottom and High
In order to keep to the main commodities or those with the biggest losses, our focus will be on WTI crude, spot gold, U.S. copper futures and U.S. coffee futures:
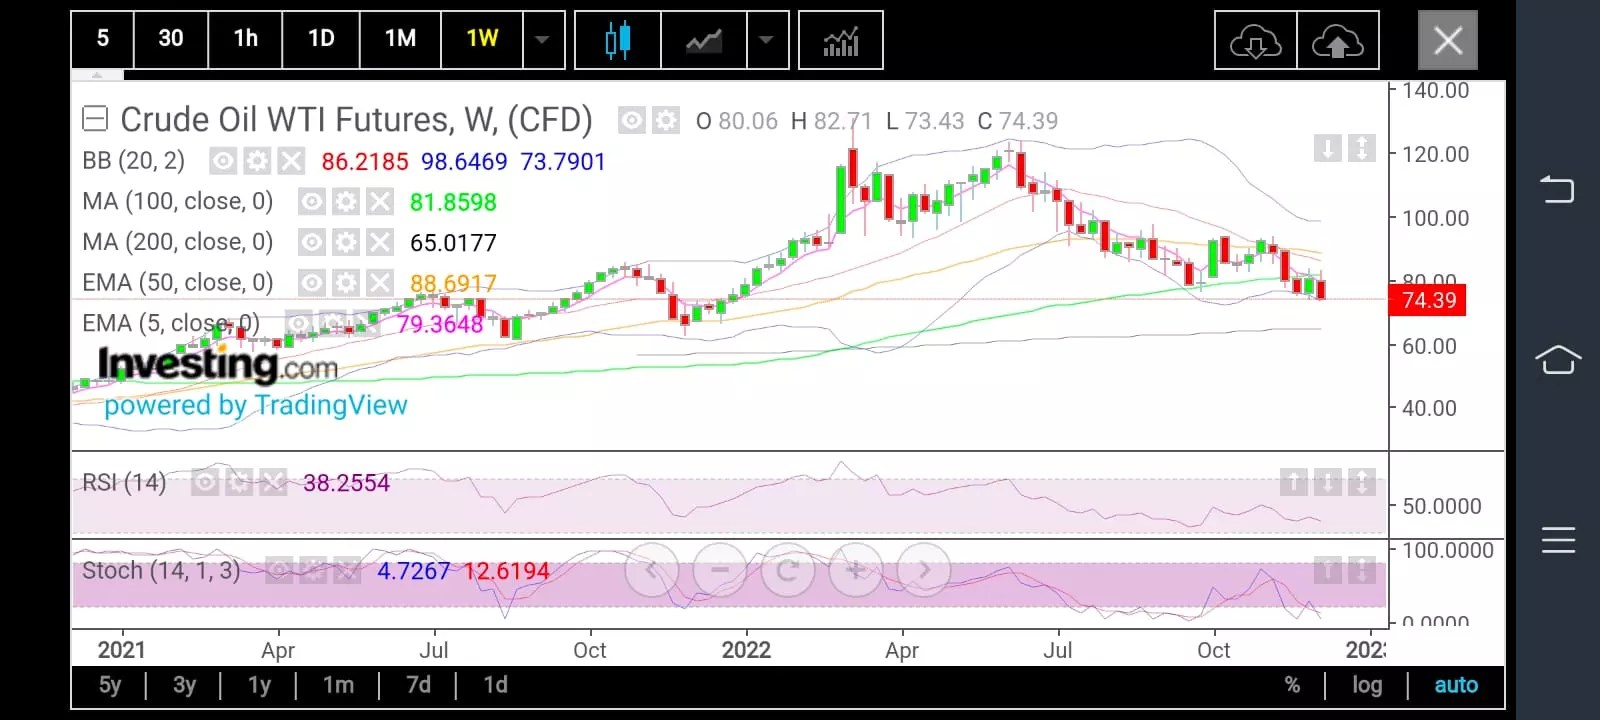 Crude Oil Futures Weekly Chart
WTI (-0.9%): U.S. crude continues to hover at a low altitude, in close proximity to what may prove to be a short-term bottom. It is likely to explore the 200-month Simple Moving Average, or SMA, of $72.55 and the 50-Month EMA of $71.20.
A rebound from the support zone is likely to meet immediate resistance levels of the 100-Week SMA of 481.86 followed by the Weekly Middle Bollinger Band of $86.20
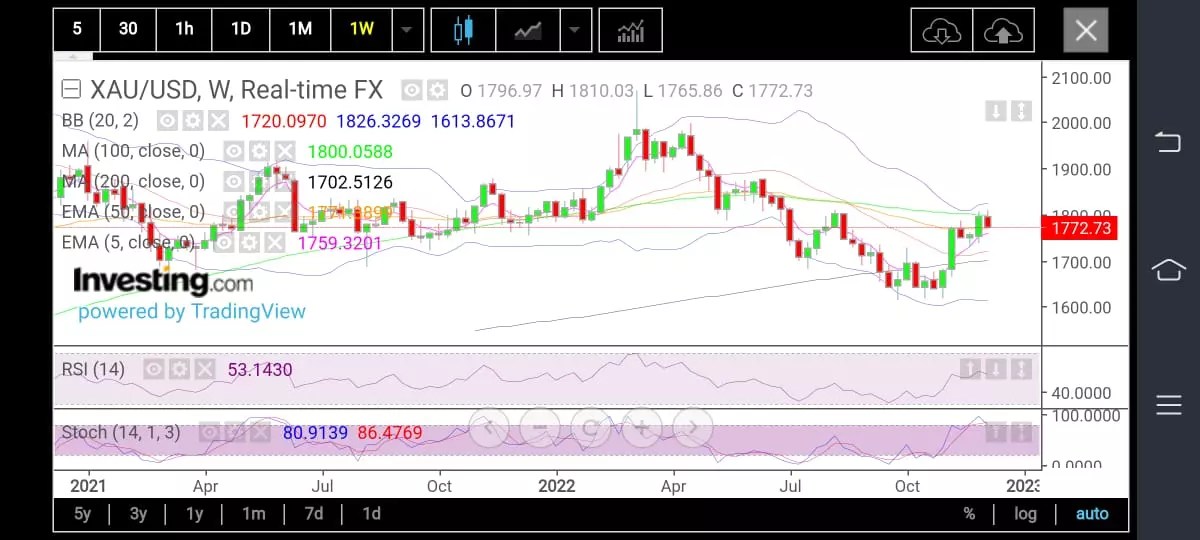 XAU/USD Weekly Chart
Spot gold (-3.0%): Bullion is seen consolidating below the 100-week SMA of $1,800 and above the 5-week EMA of $1,760. The bullish trend will likely remain, so long as prices hold above $1,760.
Sustainability above $1,777 may be an initial signal for the resumption of an up move towards $1,800, with $1810 and $1825 as next immediate targets.
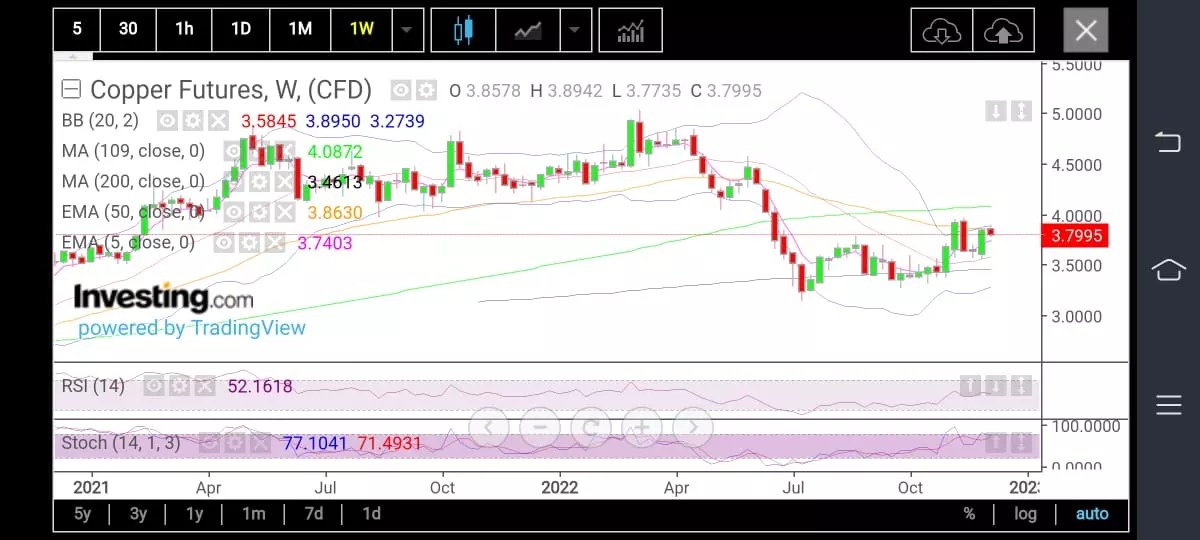 Copper Futures Weekly Chart
U.S. copper (-12.77%): Action indicates a bottom between $3.50 and $3.30 per lb.
Beyond that, the bullish trend appears intact for copper with its Relative Strength Index at 52 above neutrality and stochastics at 76/71, favoring positivity. Copper’s uptrend also remains supported by the 5-week EMA at $3.74 and the weekly middle Bollinger Band at $3.58. Challenges to overcome remain the 50-week EMA of $3.86, followed the by 100-week SMA of $4.08.
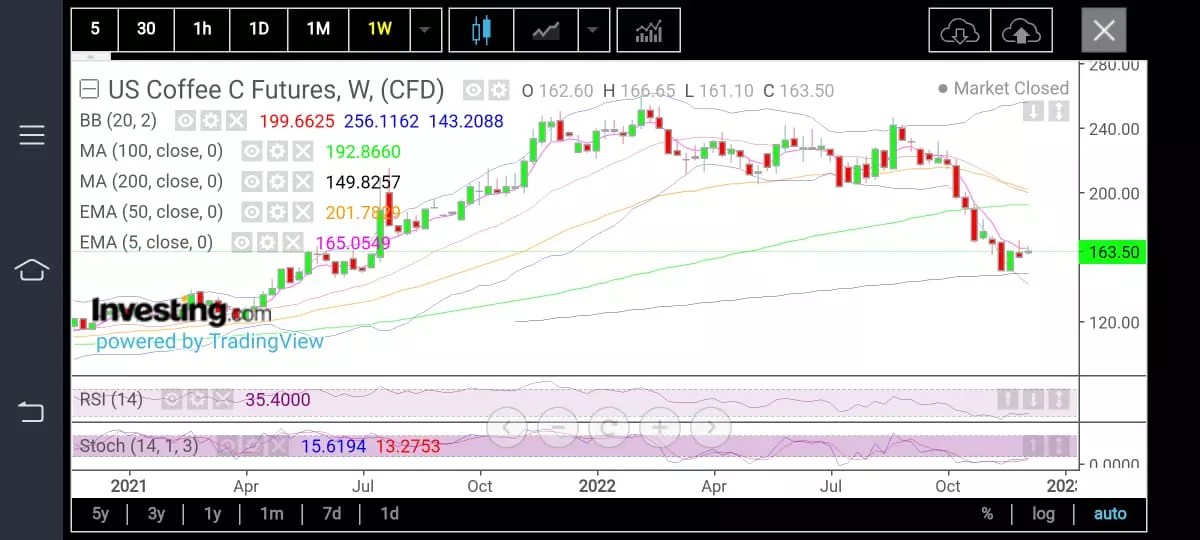 U.S. Coffee Futures Weekly Chart
U.S. coffee (-27.44%): The market has been reeling under bearish pressure for a fairly long time. As long as prices sustain below the 50-month EMA of $1.6740 an lb and the 5-week EMA of $1.65, coffee may continue with a bias skewed downward towards the 200-week SMA of $1.4980.
Weekly RSI at 35 is below neutrality while weekly stochastics at 15/13 has a lazy look up.
Commodity Winners – Potential High and Bottom
Our focus here is on two of the biggest winners in commodities: natural gas and orange juice.
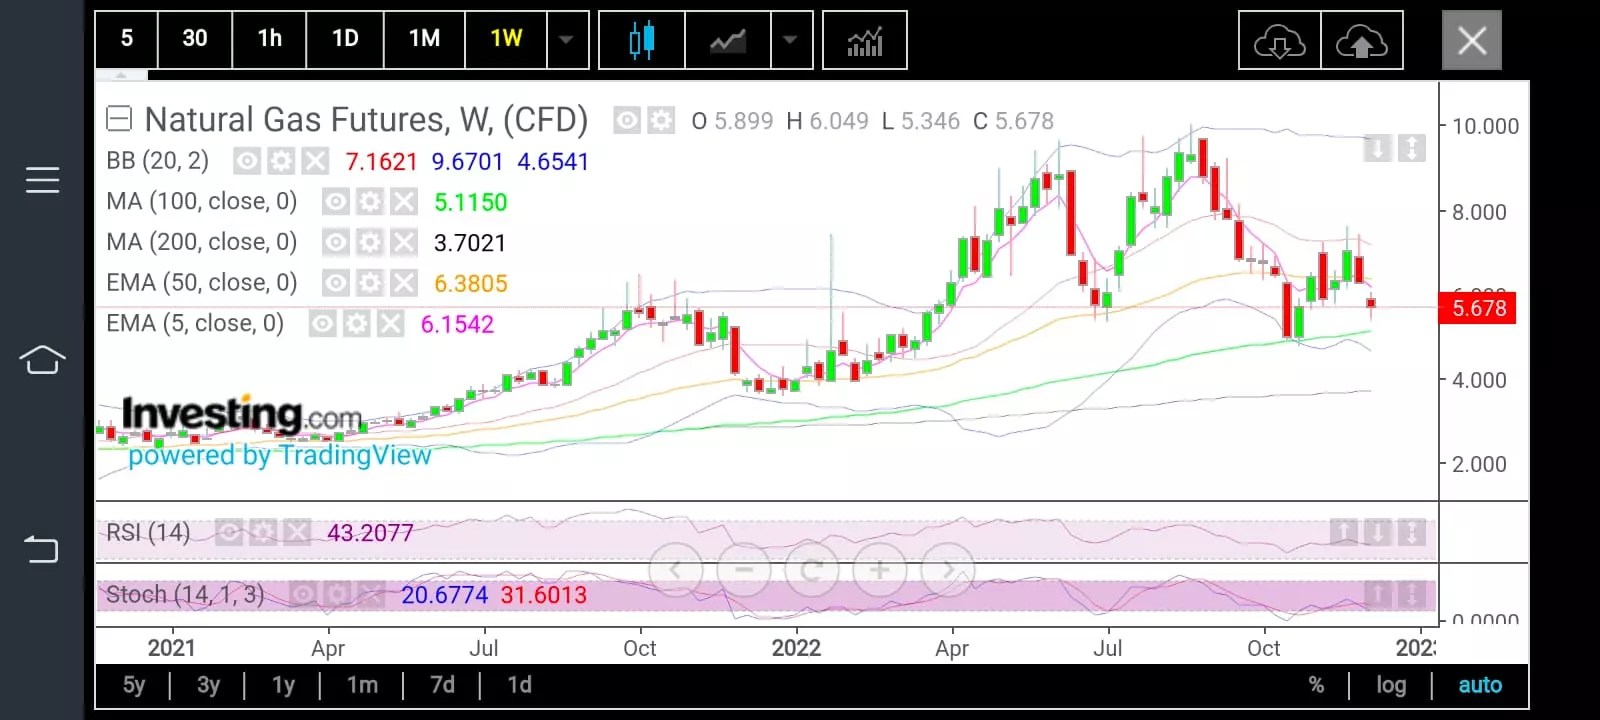 Natural Gas Futures Weekly Chart
Natural Gas (+50.08%): The heating fuel was left with a runaway gap when prices dropped below $6.22 the previous week. While current bearish pressure looks set to retest the 100-week SMA of $5.11, the recovery is more about filling the runaway gap at $6.22 and retesting the 50-week EMA of $6.38.
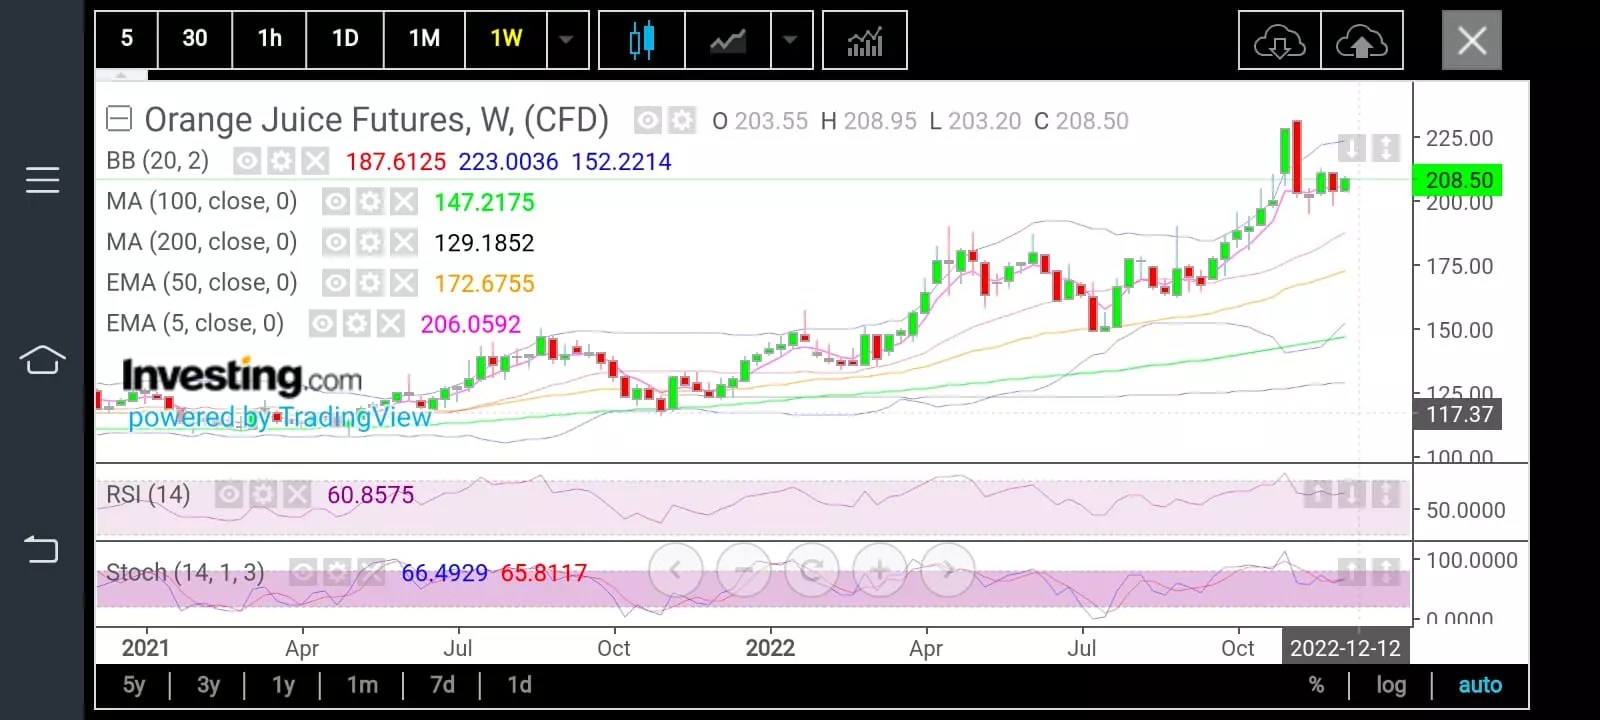 Orange Juice Futures Weekly Chart
Orange juice (+42.39%): The short and mid term price outlook remains bullish with strong positioning of weekly RSI at 61 and Weekly stochastics at 66/65. Gains may extend to $2.23 per lb, which would require a hold above $1.94. If that support gives way, then the correction could extend towards $1.87 and $1.72.
* All charts by SKCharting.com, with data powered by Investing.com.
Disclaimer: Barani Krishnan uses a range of views outside his own to bring diversity to his analysis of any market. For neutrality, he sometimes presents contrarian views and market variables. He does not hold positions in the commodities and securities he writes about.
Source: Investing.com


